
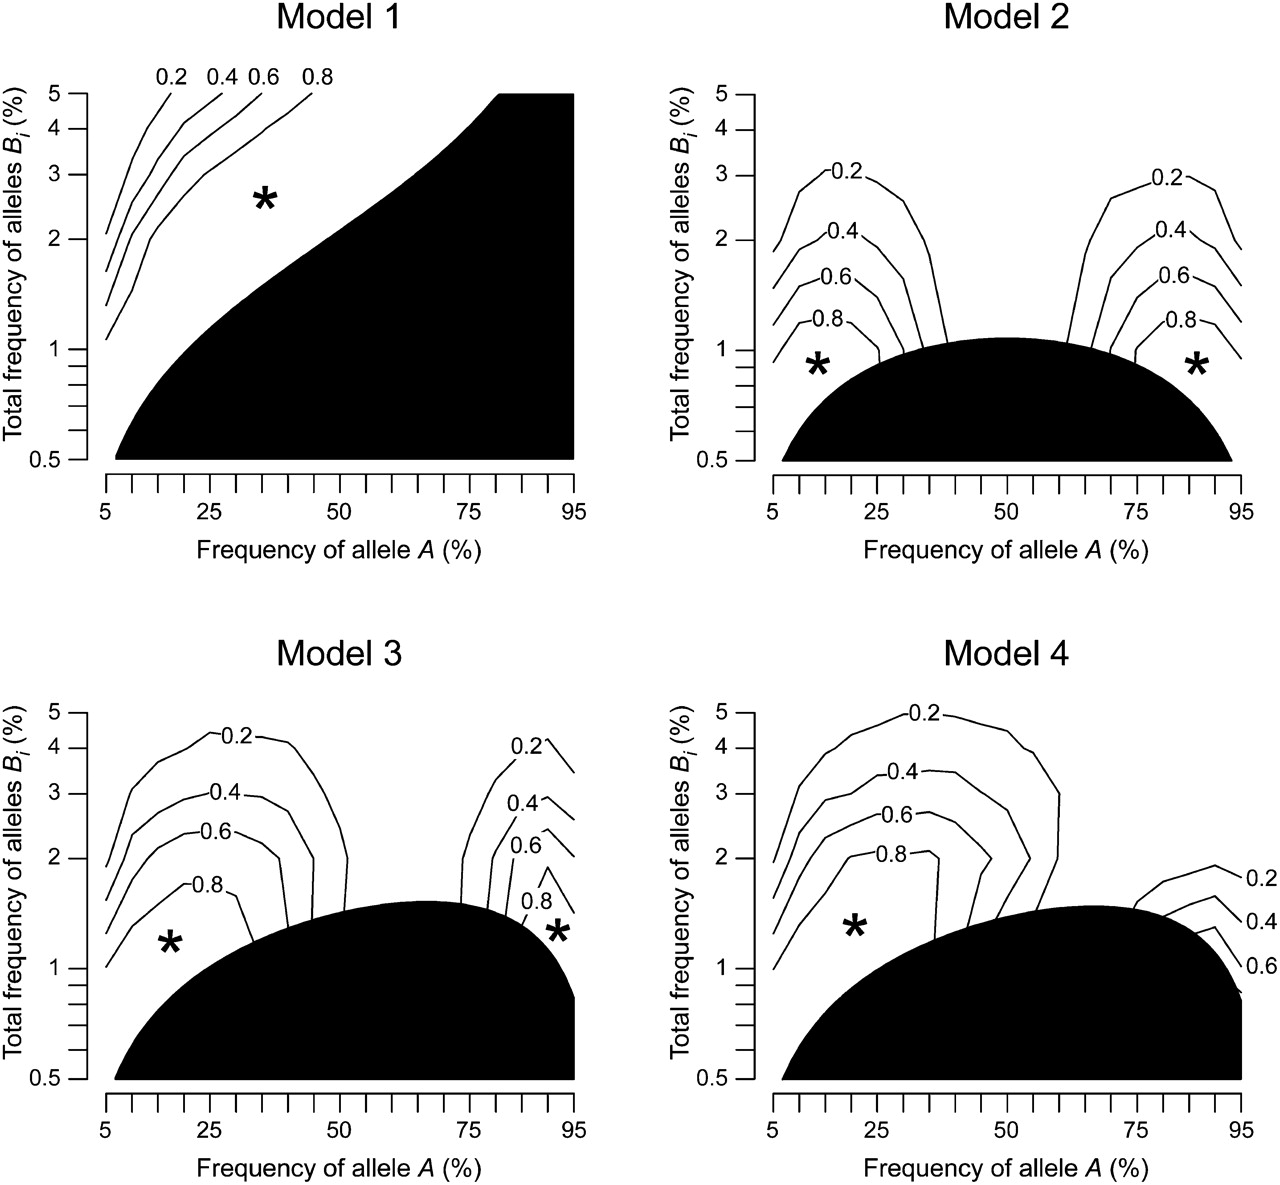
Figure 3.
Power for detecting synthetic association by testing heteroscedasticity. The power was computed from simulation under four representative genetic models of synthetic association (see Methods), assuming the strength of marker association (R2mrk) of 0.00592. Horizontal and vertical axes represent the frequency of the marker allele A, and the cumulative frequency of causal alleles Bi (linked to allele A), respectively. The asterisk indicates the region where synthetic association is detectable with power >0.8. The black region of the parameter space should be neglected, as it does not include causal variants accounting for the marker association.


