
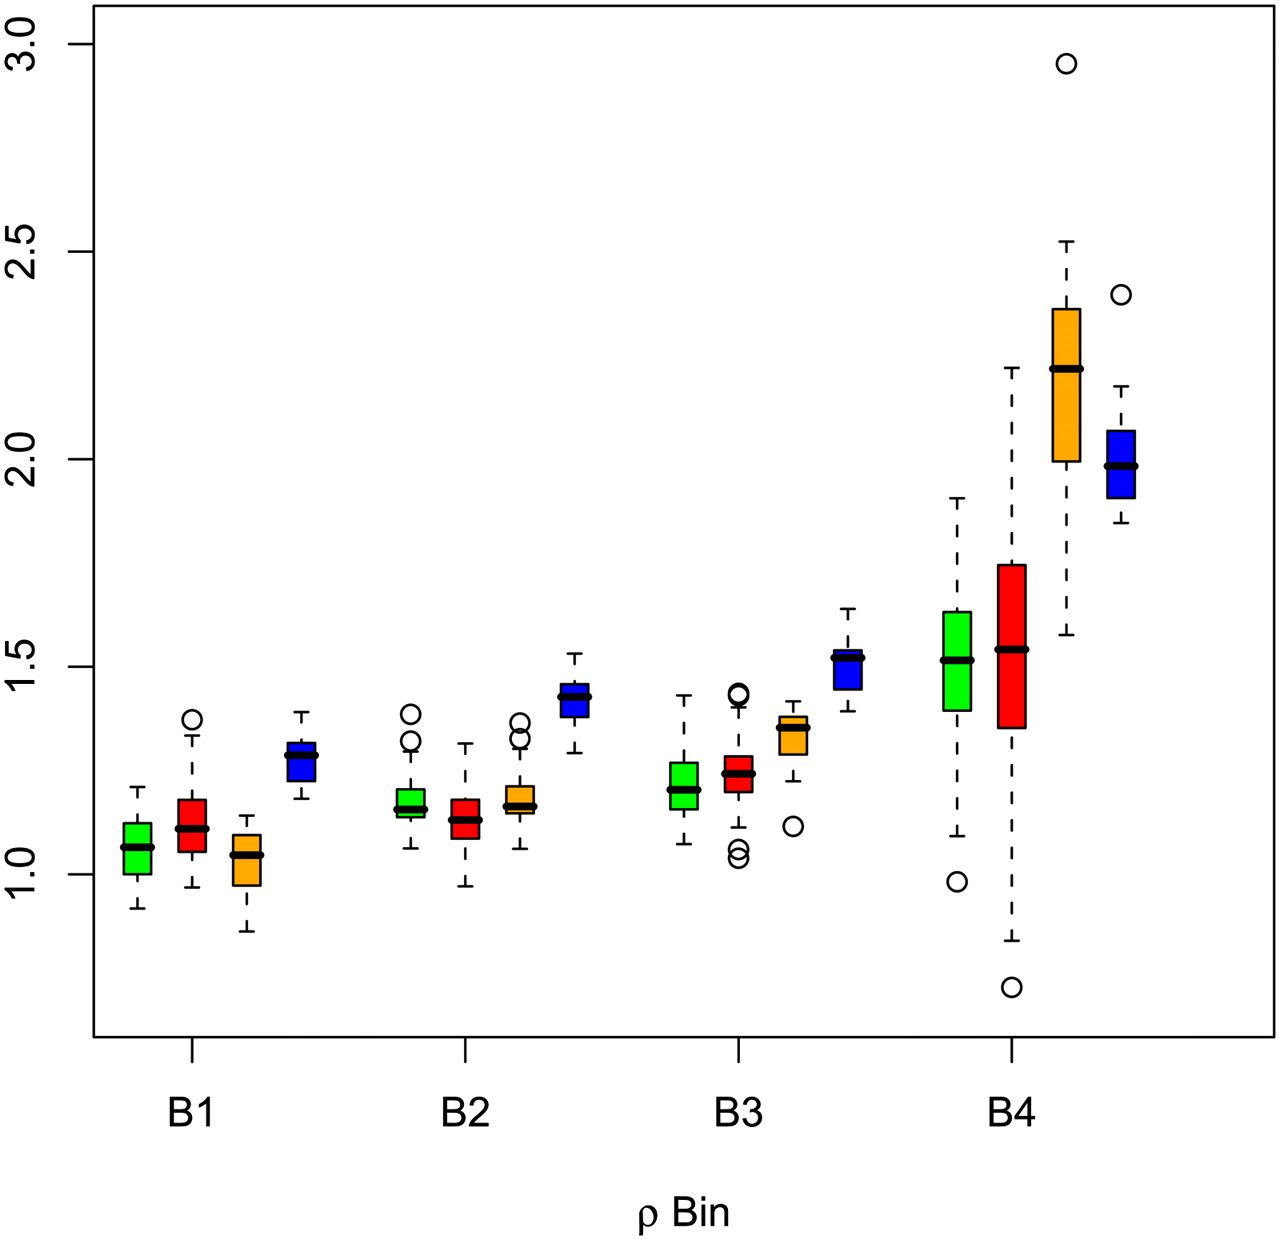
Figure 5.
Patterns of diversity reduction are related to distance from genes and sequence conservation. Genetic distance is reported in units of ρ = 4Nr; using the estimates of r from the HapMap project (http://hapmap.ncbi.nlm.nih.gov/). B1: 5 × 10⁻⁶ < ρ ≤ 10−2; B2: 10−2 < ρ ≤ 10−1; B3: 10−1 < ρ ≤ 1; B4: ρ > 1. Green indicates nucleotide diversity; red, sequence divergence between populations; orange, sequence divergence between human and chimpanzee; and blue, phascons score. In each bin, the parameters have been scaled by their corresponding values for ρ ≤ 5 × 10⁻⁶.


