
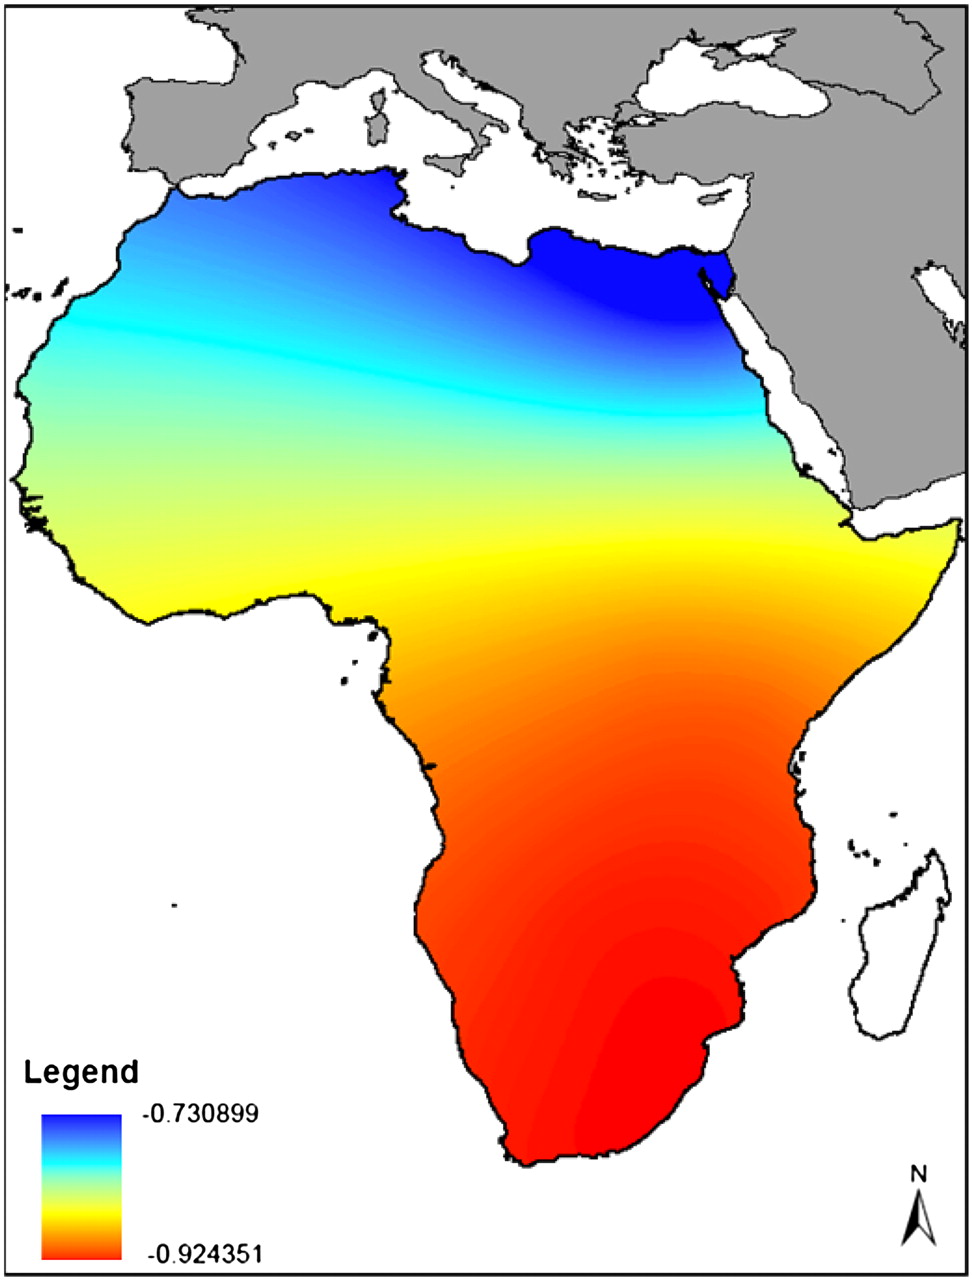
Figure 3.
Heat map of the correlation between nucleotide diversity and geographic distance from locations within Africa; correlation coefficients for each location are color-coded according to the legend in the figure. The African continent was subdivided into regions 100 km square, and the distance from each region's center point to each of the samples' locations was calculated analogously to what had been done previously (Ramachandran et al. 2005). Distances from geographic locations in Southeast Africa are the most strongly correlated with nucleotide diversity.


