
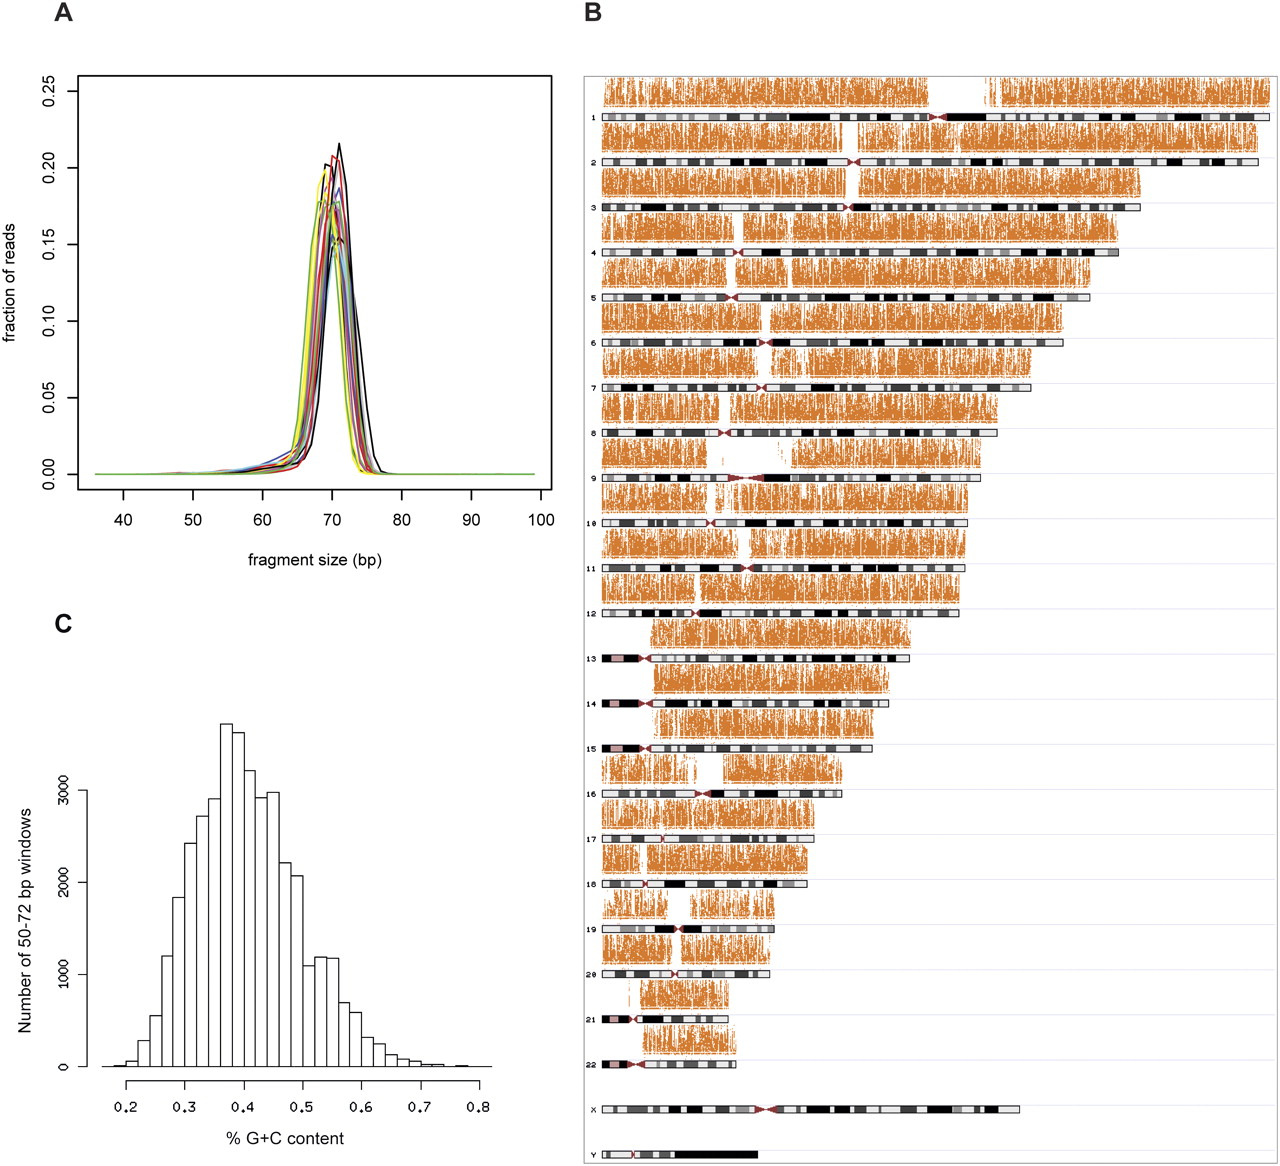
Figure 2.
Features of the sequencing target prepared by our reduced representation protocol. (A) The plot shows the distributions of the proportion of reads aligned to restriction fragments in the range 40–100 bp for the samples in this study. (B) Autosomal regions are evenly represented in the resequencing target and no apparent bias is detected in the genomic distribution of coverage depth (vertical axis). (C) The plot shows the distribution of %G + C content for the sequencing target, which is very similar to the distribution reported for the entire human genome (Lander et al. 2001).


