
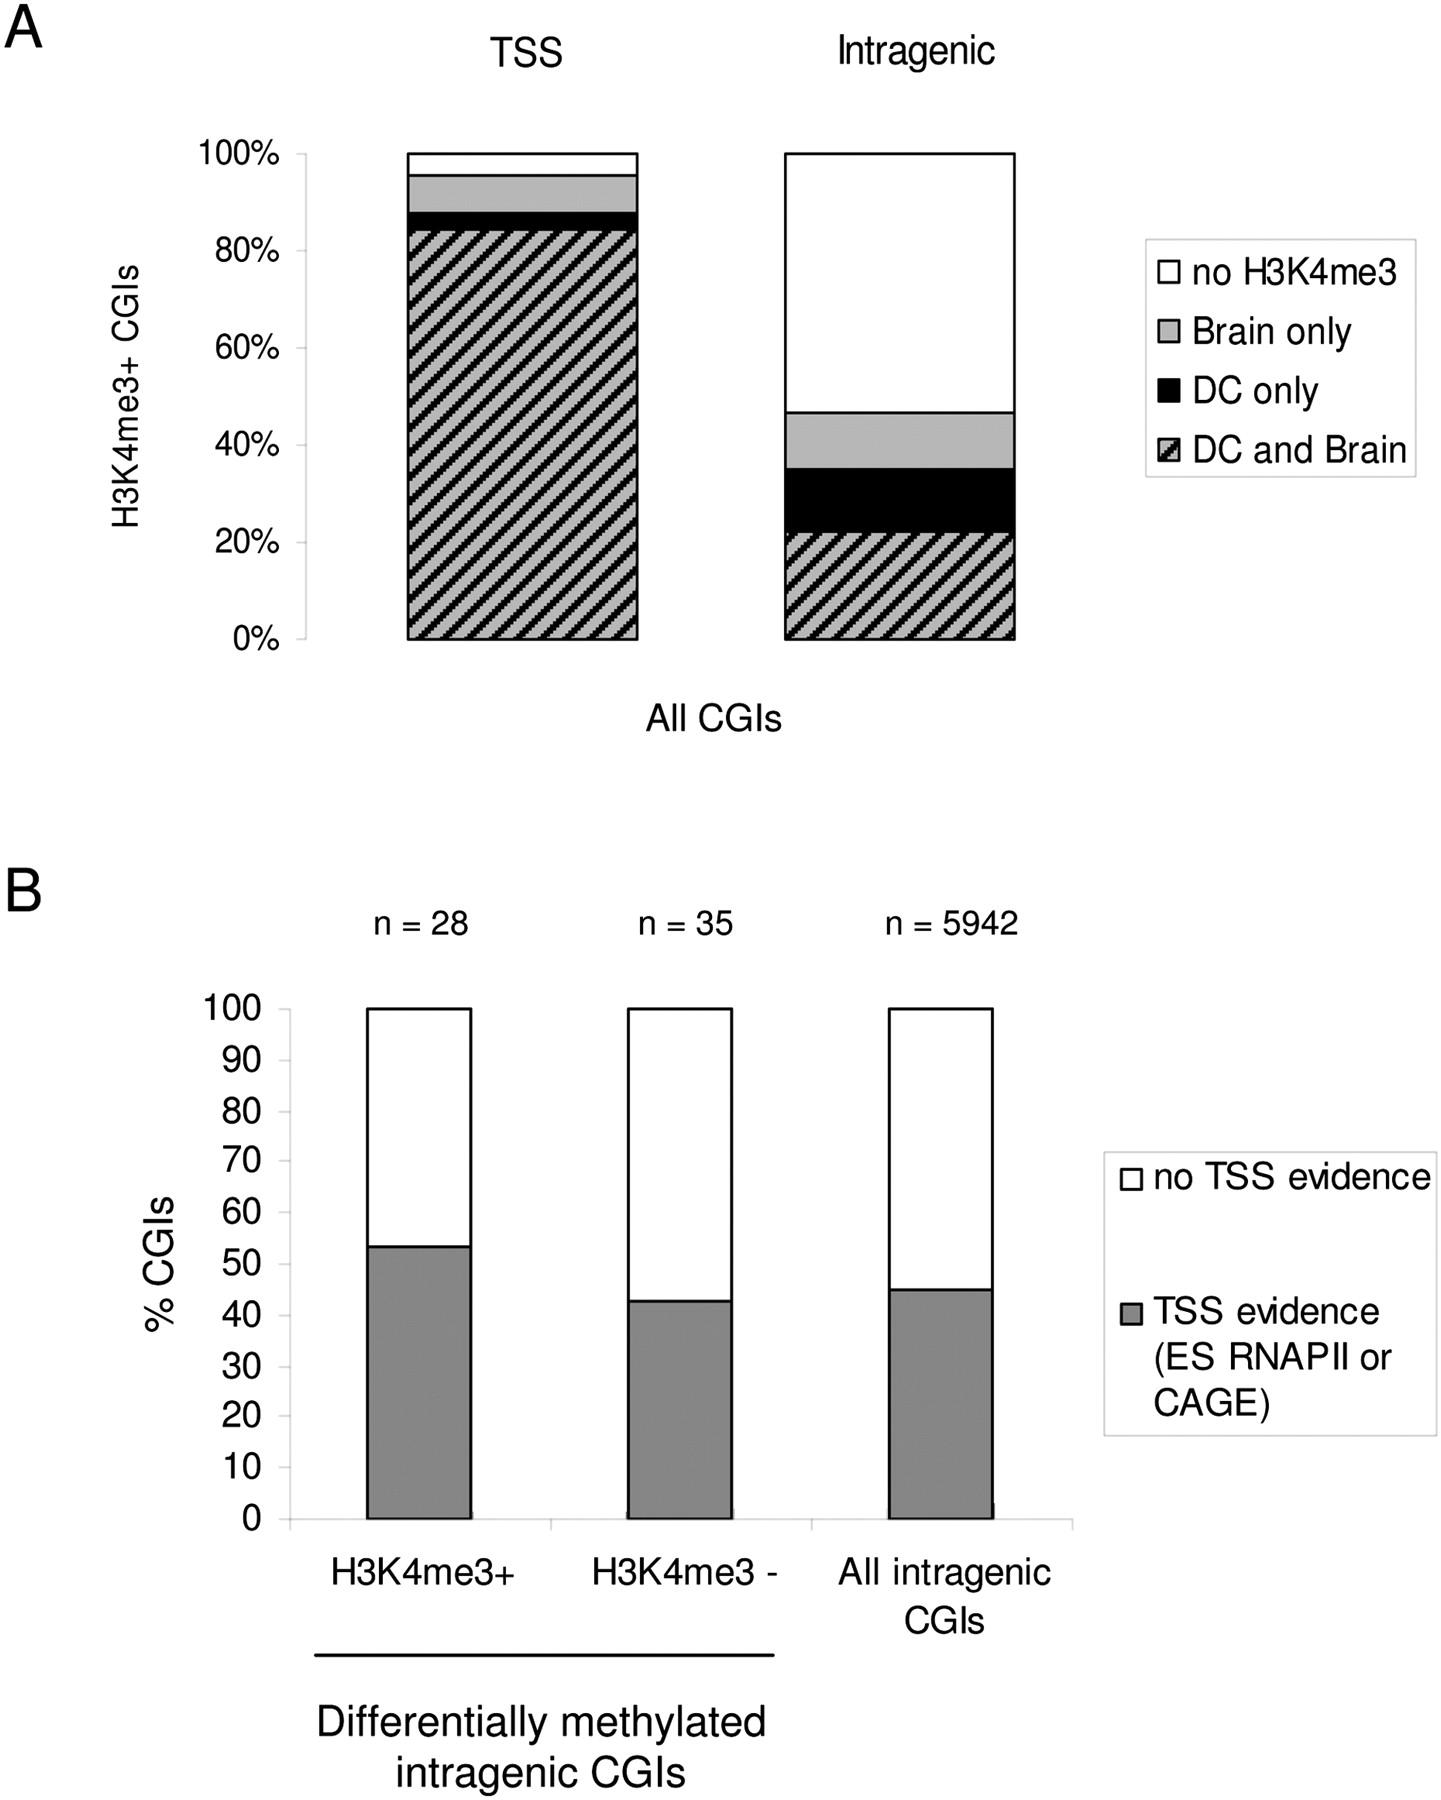
Figure 6.
Intragenic CGIs frequently show tissue-specific H3K4me3, and differentially methylated intragenic CGIs have evidence for promoter function. (A) The percentage of TSS and intragenic CGIs that are positive for H3K4me3 in brain (gray), dendritic cells (black), or both (stripes). (B) RNAPII binding data for ES cells and CAGE data for mouse tissues was used to infer whether intragenic CGIs have evidence for association with a TSS (see Methods). H3K4me3 positive and H3K4me3 negative differentially methylated intragenic CGIs are shown, along with all intragenic CGIs in the mouse genome.


