
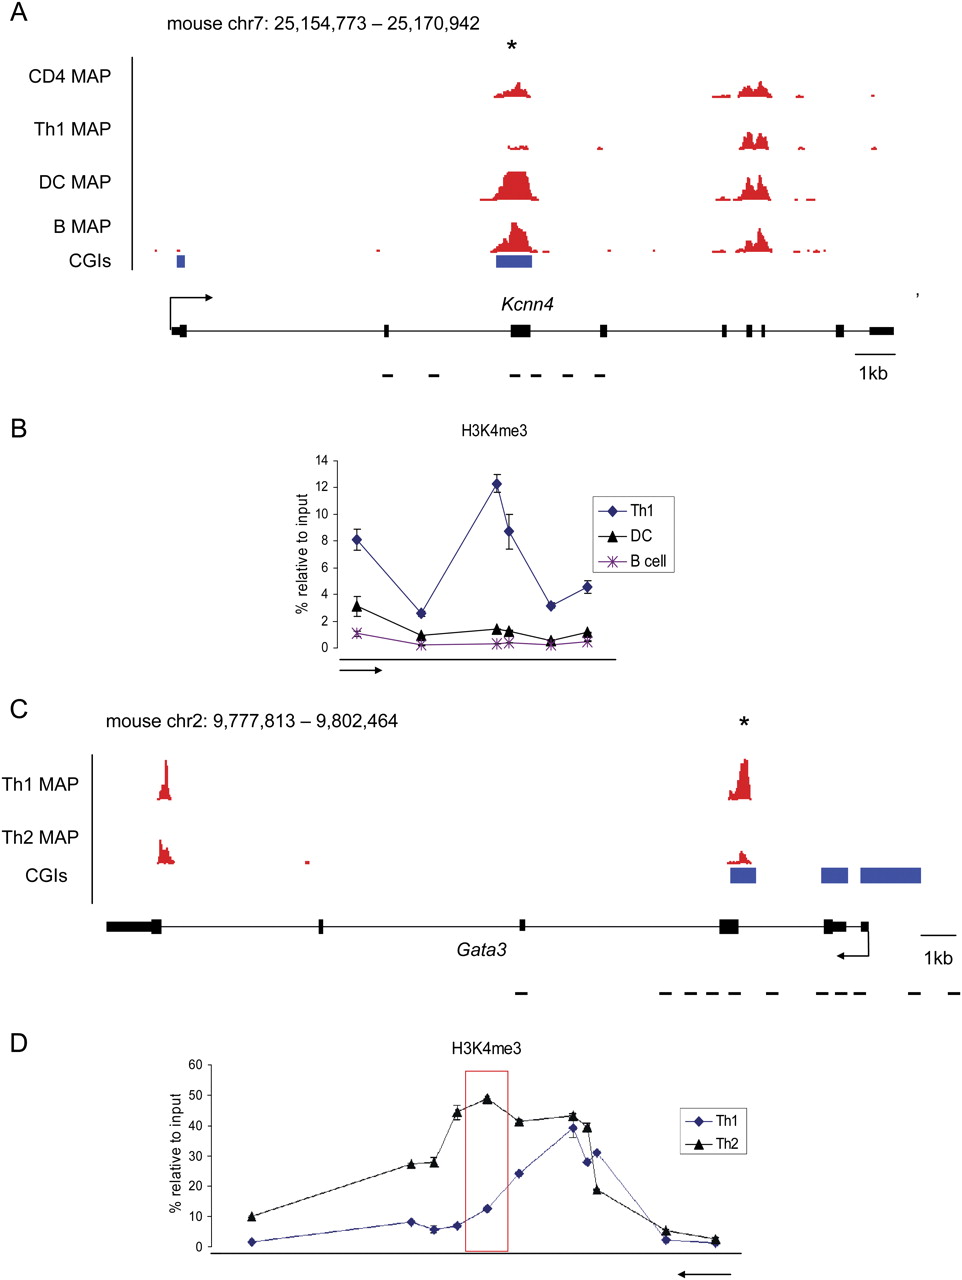
Decreased DNA methylation is associated with increased H3K4me3 at the Kcnn4 and Gata3 intragenic CGIs. (A) MAP-seq read density profile (red) showing a methylation difference between Th1 cells, dendritic cells (DC), and B cells at a CGI in Kcnn4 gene (asterisk). (B) ChIP combined with qPCR across the Kcnn4 locus reveals specific enrichment for H3K4me3 in Th1 cells where the intragenic CGI is hypomethylated. (C) The methylation difference between Th1 and Th2 cells at the Gata3 locus (asterisk) is associated with a difference in H3K4me3 specifically over the intragenic CGI (red box) (D). For both genes, the arrow indicates the origin and direction of transcription, blue indicates CGIs, and black lines indicate the position of PCR primer pairs.


