
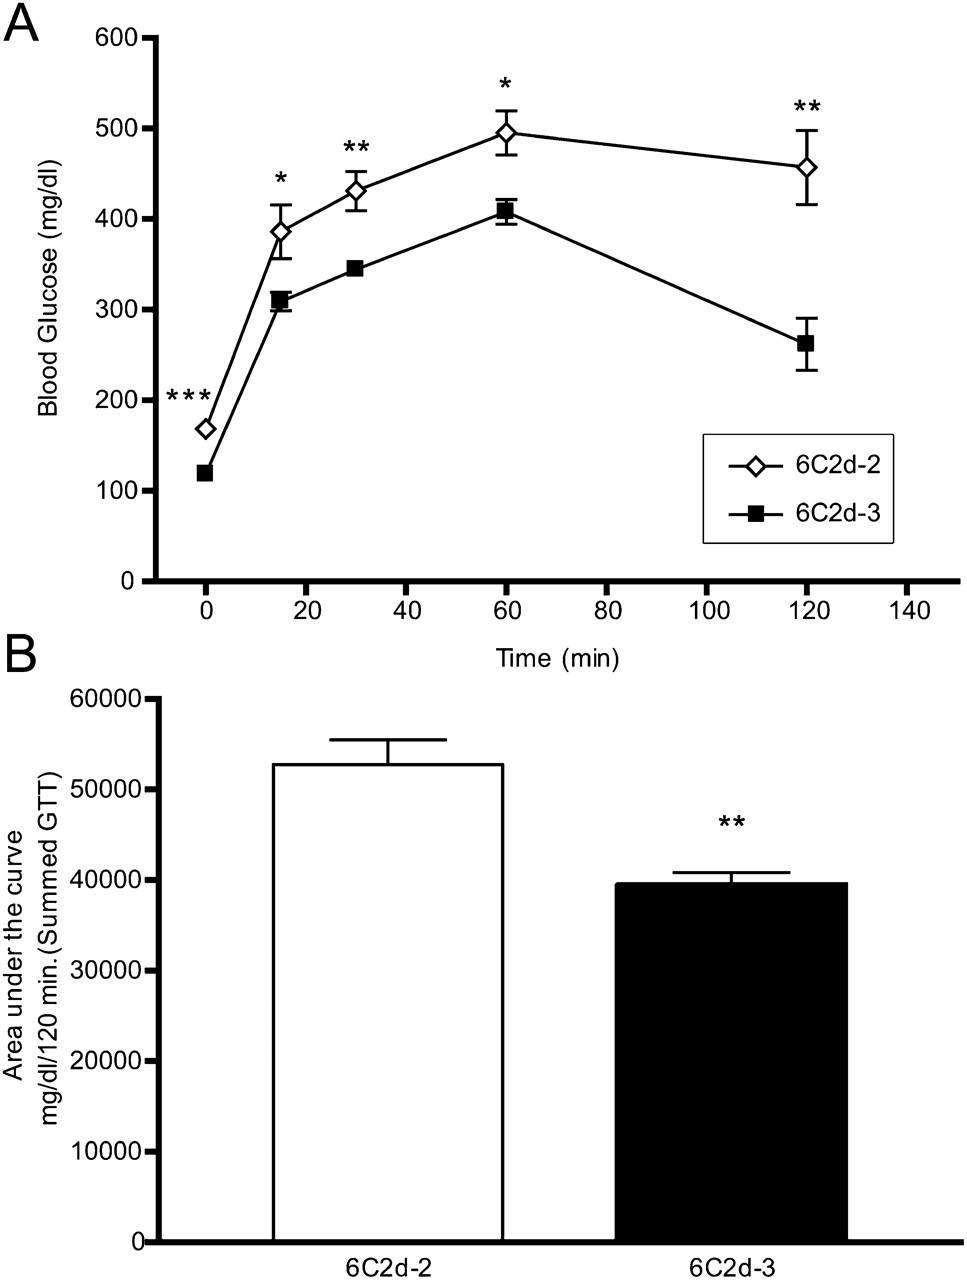
Figure 2.
Strain 6C2d-2 has increased fasting glucose levels and decreased glucose tolerance compared to 6C2d-3. (A) Glucose levels were measured 15, 30, 60, and 120 min following an IP injection of glucose (n = 8). (B) Area under the curve (AUC) was calculated by summing the integration values of consecutive linear segments of the glucose curve shown in panel A. *P < 0.05, **P < 0.01, and ***P < 0.001.


