
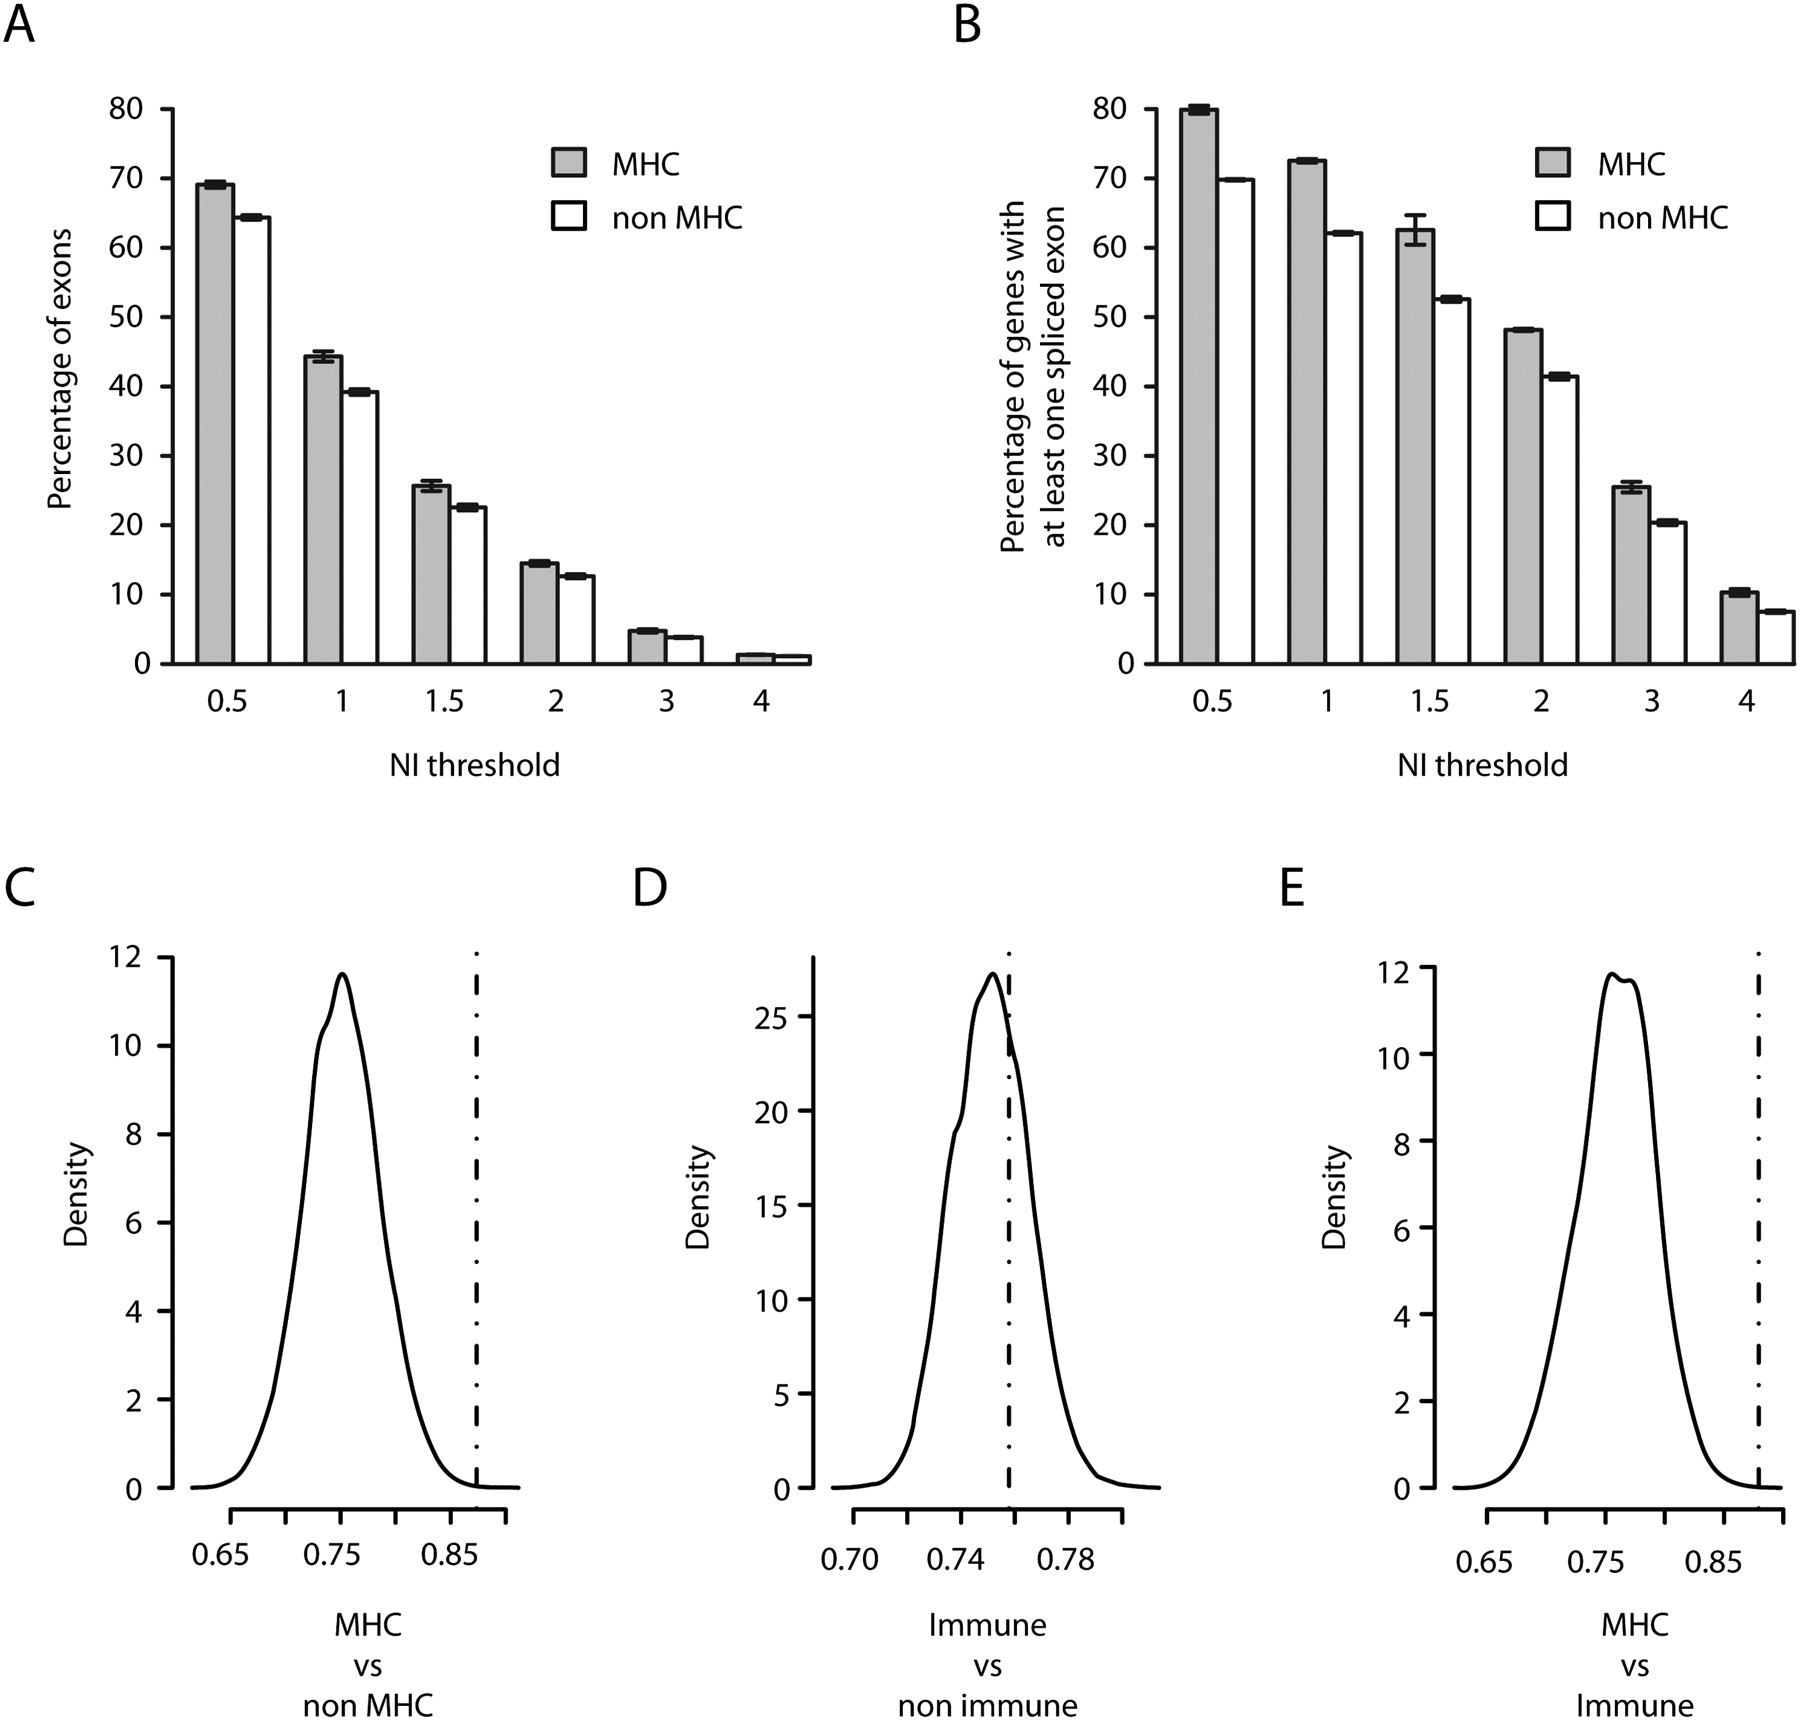
Extent of alternative splicing in the MHC. Absolute values of exon level intensities normalized against gene intensities [NI = log2(exon/gene)] were computed from the median signal of the three PGF sample replicates hybridized to the Affymetrix Exon 1.0 ST array. Thus, absolute NI > 1 indicates that the exon is expressed at least twice more or less than the overall gene level. Mean percentage of exons (A) and of genes with at least one exon (B) with NI value(s) exceeding the indicated thresholds for MHC (gray bars) and non-MHC genes (white bars). Error bars depict standard errors of the means of the three replicates (C–E) Comparisons of the median NIs (dashed vertical line) in the 131 MHC genes (C,E) or in 733 non-MHC immune genes (D) having at least four annotated exons in Vega with the density distribution of median NIs obtained in 10,000 random sets of similar numbers of non-MHC (C), non-MHC non-immune (D), and non-MHC immune (E) genes.


