
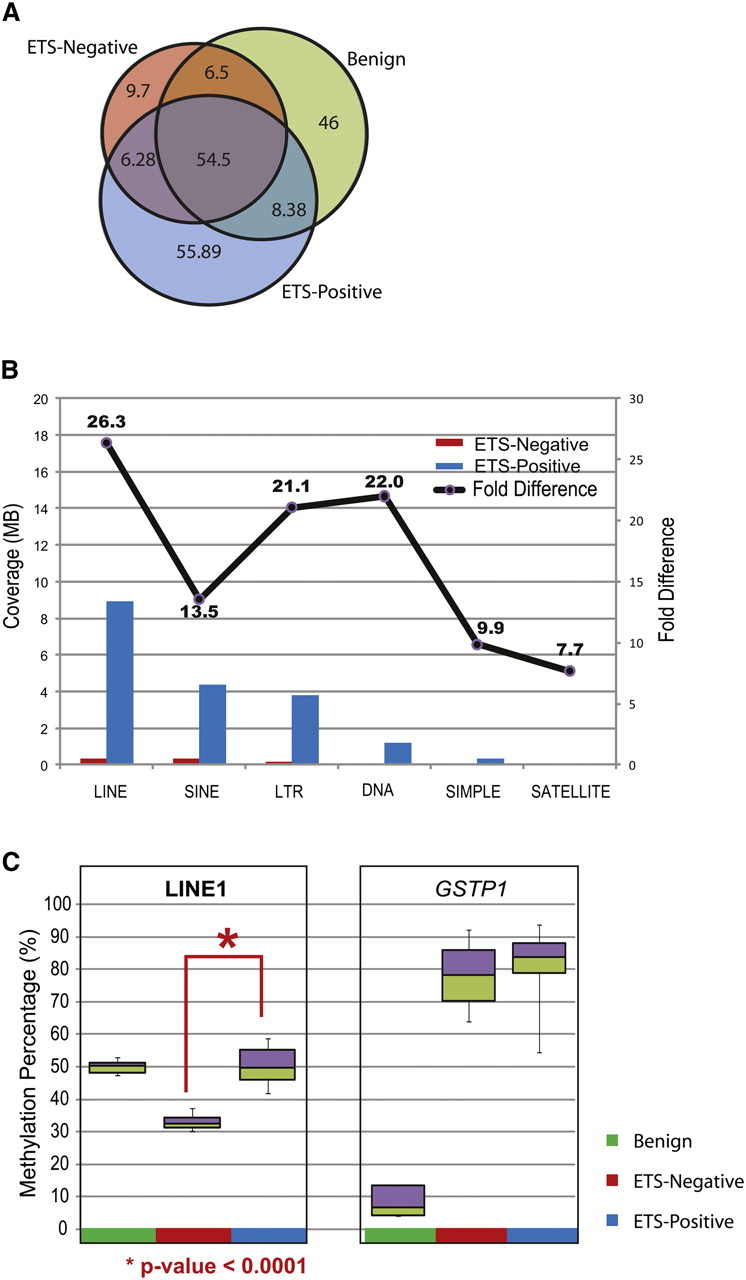
Differentially methylated regions between ETS-positive and ETS-negative samples. (A) Venn diagram displays the methylation overlap observed between ETS-positive (blue), ETS-negative (red), and benign (green) prostate tissue samples. The inset numbers represent the coverage in each section. (B) The coverage for various repeat elements was higher in ETS-positive compared to ETS-negative samples, indicating higher methylation in the former. The fold difference for methylation in each class of repeat element is indicated by the line plot above. (C) Percent methylation was assessed independently by pyro-sequencing assays for LINE-1 elements and GSTP1 gene promoter methylation in prostate tissue panel (benign n = 5, ETS-positive cancers n = 10, and ETS-negative cancers n = 4). LINE-1 methylation was significantly lower (P-value < 0.0001) in ETS-negative samples compared to ETS-positive tissues, while the GSTP1 gene promoter was highly methylated in both cancer subgroups and not in benign.


