
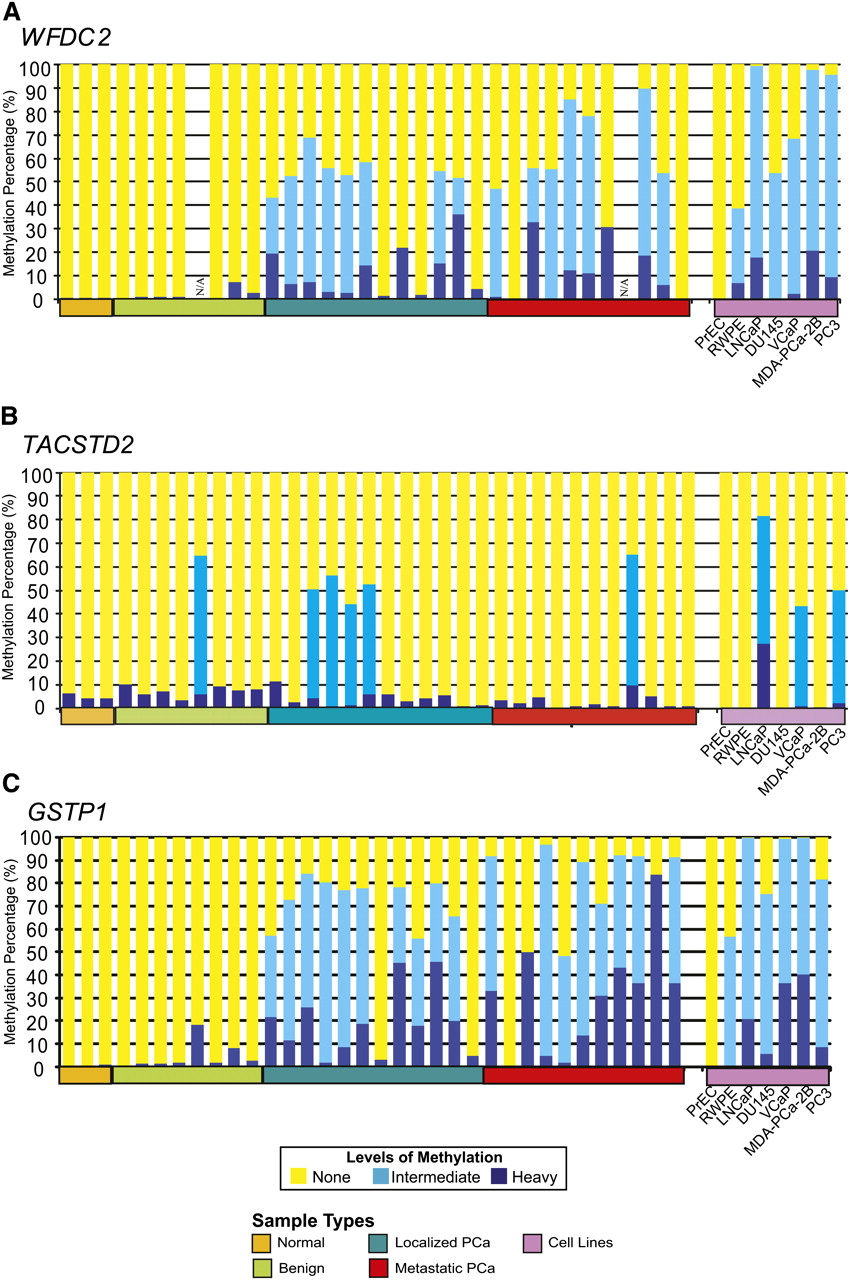
WFDC2, TACSTD2 and GSTP1 methylation in prostate tissue panel. MethylProfiler qPCR was used to determine DNA methylation of the WFDC2 (A), TACSTD2 and GSTP1 (B) genes. 17/22 prostate cancer tissues and 6/6 transformed prostate cell lines showed methylation of the WFDC2 promoter, whereas there was no detectable methylation in normal (0/3), benign adjacent tissues (0/7), or the normal PrEC cells. In each sample, the height of the yellow bars indicates no methylation; light blue bars indicate moderate methylation levels; and dark blue bars indicate heavy levels of DNA methylation. Select samples were independently validated by bisulfite sequencing of the corresponding region (Supplemental Fig. 10). (B) Methylation of the TACSTD2 promoter in prostate tissues and cell lines was assessed by MethylProfiler qPCR. Twenty-one percent cancer tissues (5/23) and prostate cancer cell lines, VCaP, LNCaP, and PC3, were methylated. (C) Methylprofiler qPCR analysis of GSTP1. 20/22 prostate cancer tissues, 1/7 benign adjacent tissues, and 6/6 transformed prostate cell lines showed methylation of the GSTP1 promoter, whereas there was no detectable methylation in normal tissues (0/3) or the normal PrEC cells.


