
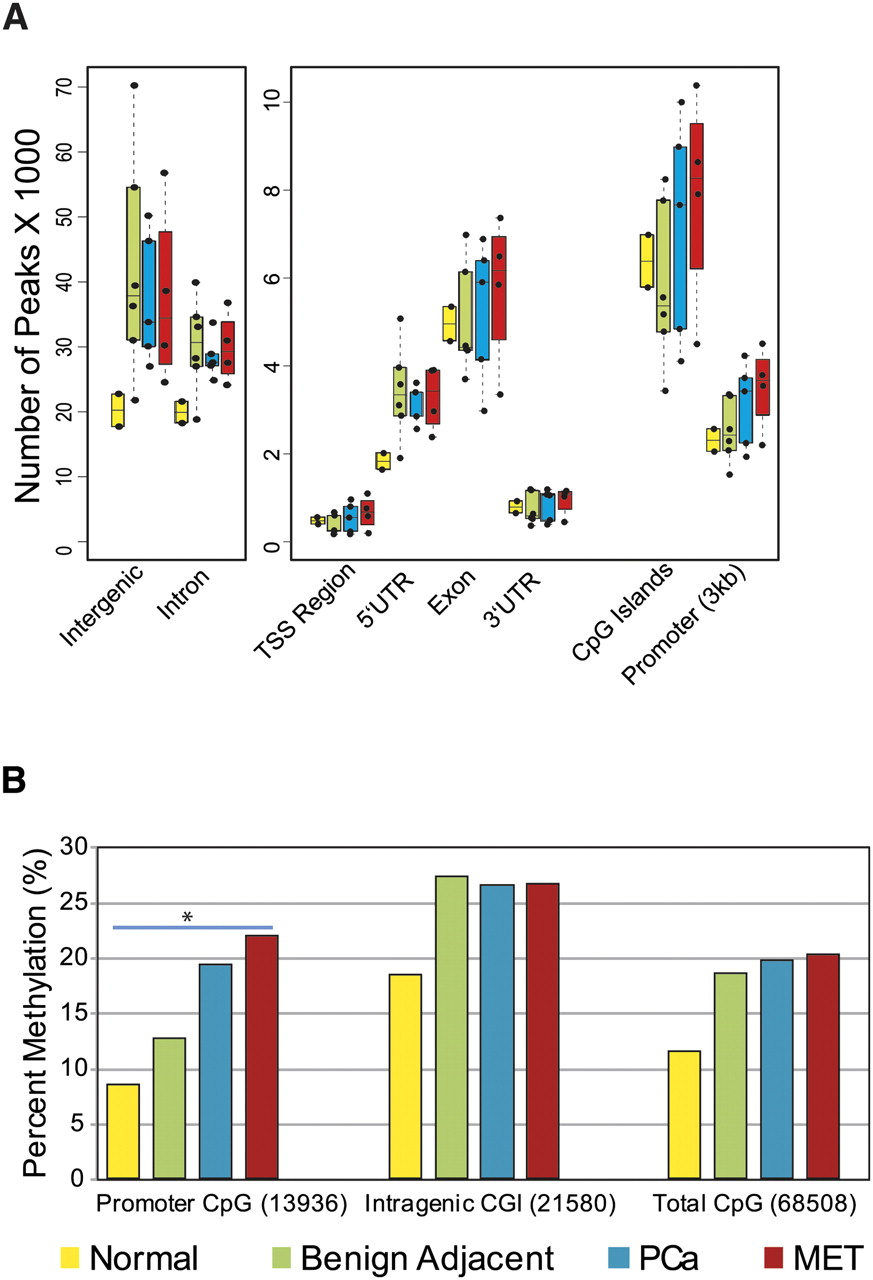
Figure 2.
DNA methylation pattern in prostate tissues. (A) Genome-wide distribution of DNA methylation in various prostate sample groups analyzed. The majority of methylation peaks are confined to intergenic and intronic regions similar to cell lines. (Yellow) Normal prostate; (green) benign adjacent; (blue) localized PCa; (red) metastatic PCa. (B) A gradual increase in percent methylation, with cancer progression among promoter CGIs compared with CGIs located in other genomic regions, was observed. (*) Pearson's χ2 test, P-value < 2 × 10⁻¹⁶.


