
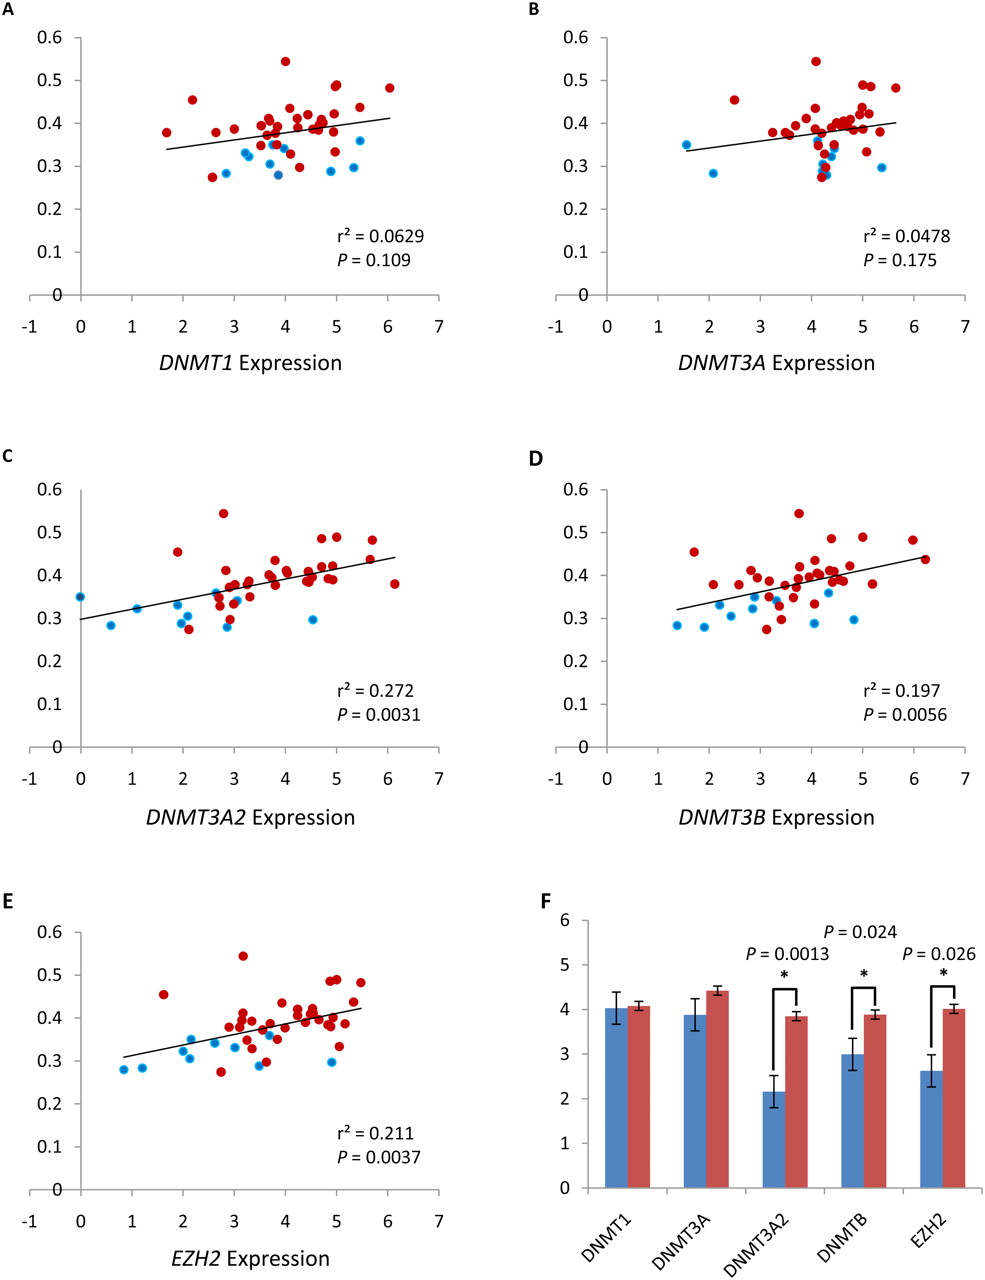
Expression of DNMTs and EZH2 correlates with global hypermethylation in prostate tumors. Comparison of transcript levels of DNMTs and EZH2 measured by TaqMan qPCR with the average DNA methylation levels of CpG sites that are hypermethylated in prostate tumors. (Blue circles) Benign adjacent samples; (red circles) tumor samples. The P-value was calculated by linear regression analysis. y-axis: average DNA methylation levels (beta score); x-axis: relative gene expression levels [log2(RQ)]; (black line) linear regression. (A) DNMT1 expression. (B) DNMT3A expression. (C) DNMT3A2 expression. (D) DNMT3B expression. (E) EZH2 expression. (F) Comparison of DNMTs and EZH2 transcript levels between benign adjacent tissues (blue) and tumors (red). Significant differences are indicated by asterisks; P-values were calculated by t-test. Standard errors are depicted by error bars. For part F, the y-axis is relative gene expression levels [log2(RQ)].


