
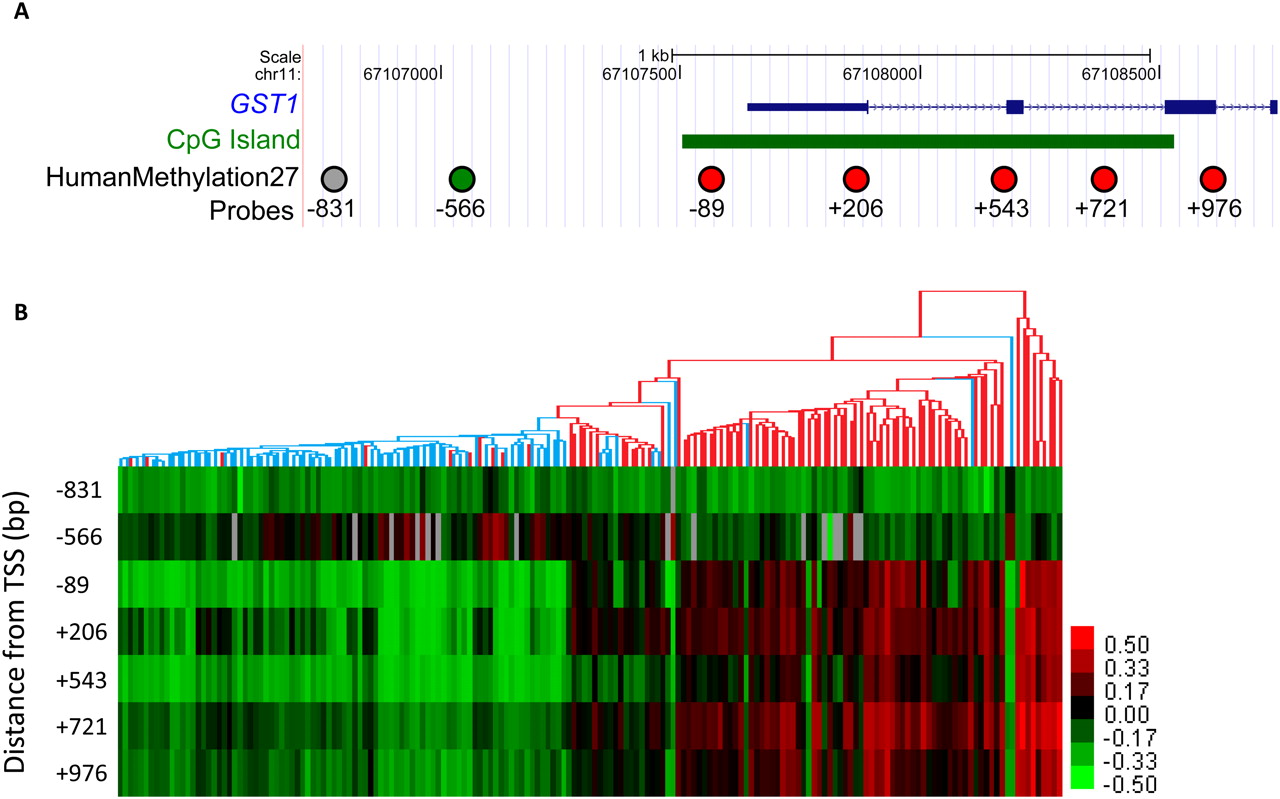
GSTP1 CpG island hypermethylation in prostate tumors. (A) Diagram of the RefSeq annotation of the GSTP1 gene. (Green box) CpG island calculated by the UCSC Genome Browser. Circles are CpG sites assayed by HumanMethylation27. (Red circles) Probes that were identified to be hypermethylated in prostate tumors by 2-class SAM; (green circle) probe that was hypomethylated; (gray circle) probe that showed no significant change. The numbers below the circles indicate the relative distance in base pairs from the predicted TSS. (B) Heatmap depicts DNA methylation pattern of the seven probes near GSTP1. The dendrogram is based on the hierarchical clustering from Figure 2. (Red branches) Tumor samples; (blue branches) benign adjacent samples. Coordinates are based on the NCBI36/hg18 human genome assembly.


