
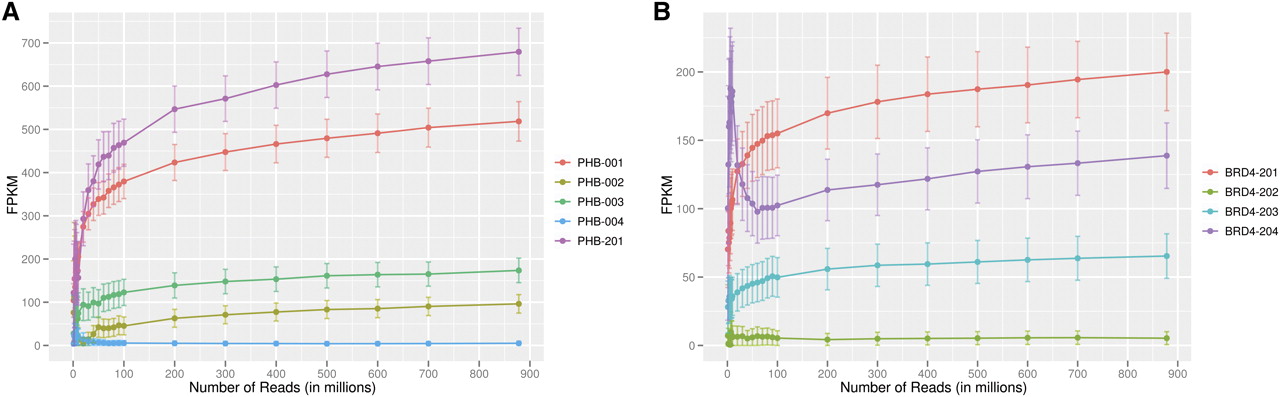
Figure 6.
Expression levels versus sequencing depth. We plotted FPKM values for genes and their transcripts at various sequencing depths. (A) FPKM values of five spliced forms of PHB are shown; the least abundant isoform (blue line) of PHB reaches within 20% of its “final” FPKM value with only 60 million reads; however, the expression values of the other four isoforms continued to increase with more reads. (B) FPKM values of BRD4 are shown. With less than 100 million reads, the expression level of BRD4-201 (orange line) is overestimated, while that of BRD4-204 (purple line) is underestimated. (Error bars represent 95% confidence intervals.)


