
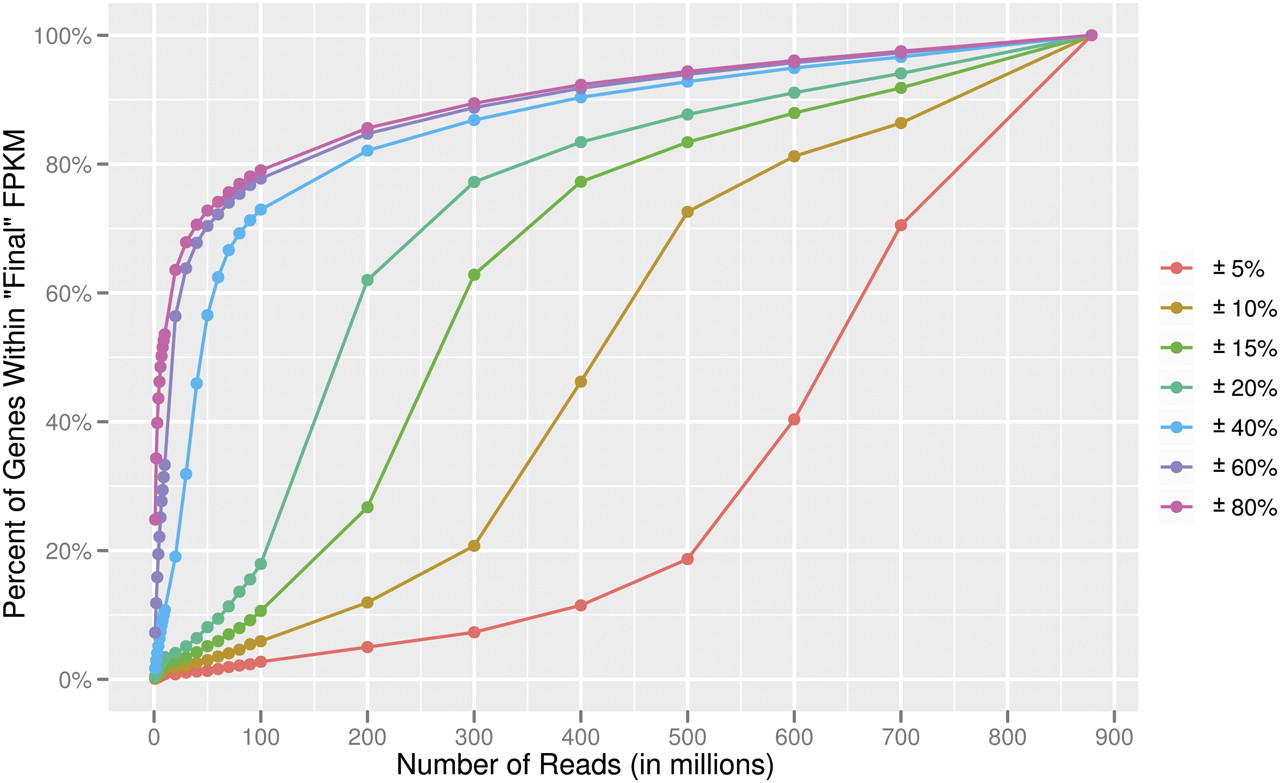
Figure 5.
Gene expression levels at different sequencing depths. The percentages of genes that reach values within different percentages of the “final” level obtained at a depth of 879 million reads were determined. With 100 million reads, only 6% of genes have FPKM measurements that are within 10% (gold line) of their “final” value compared to 72% at a depth of 500 million reads.


