
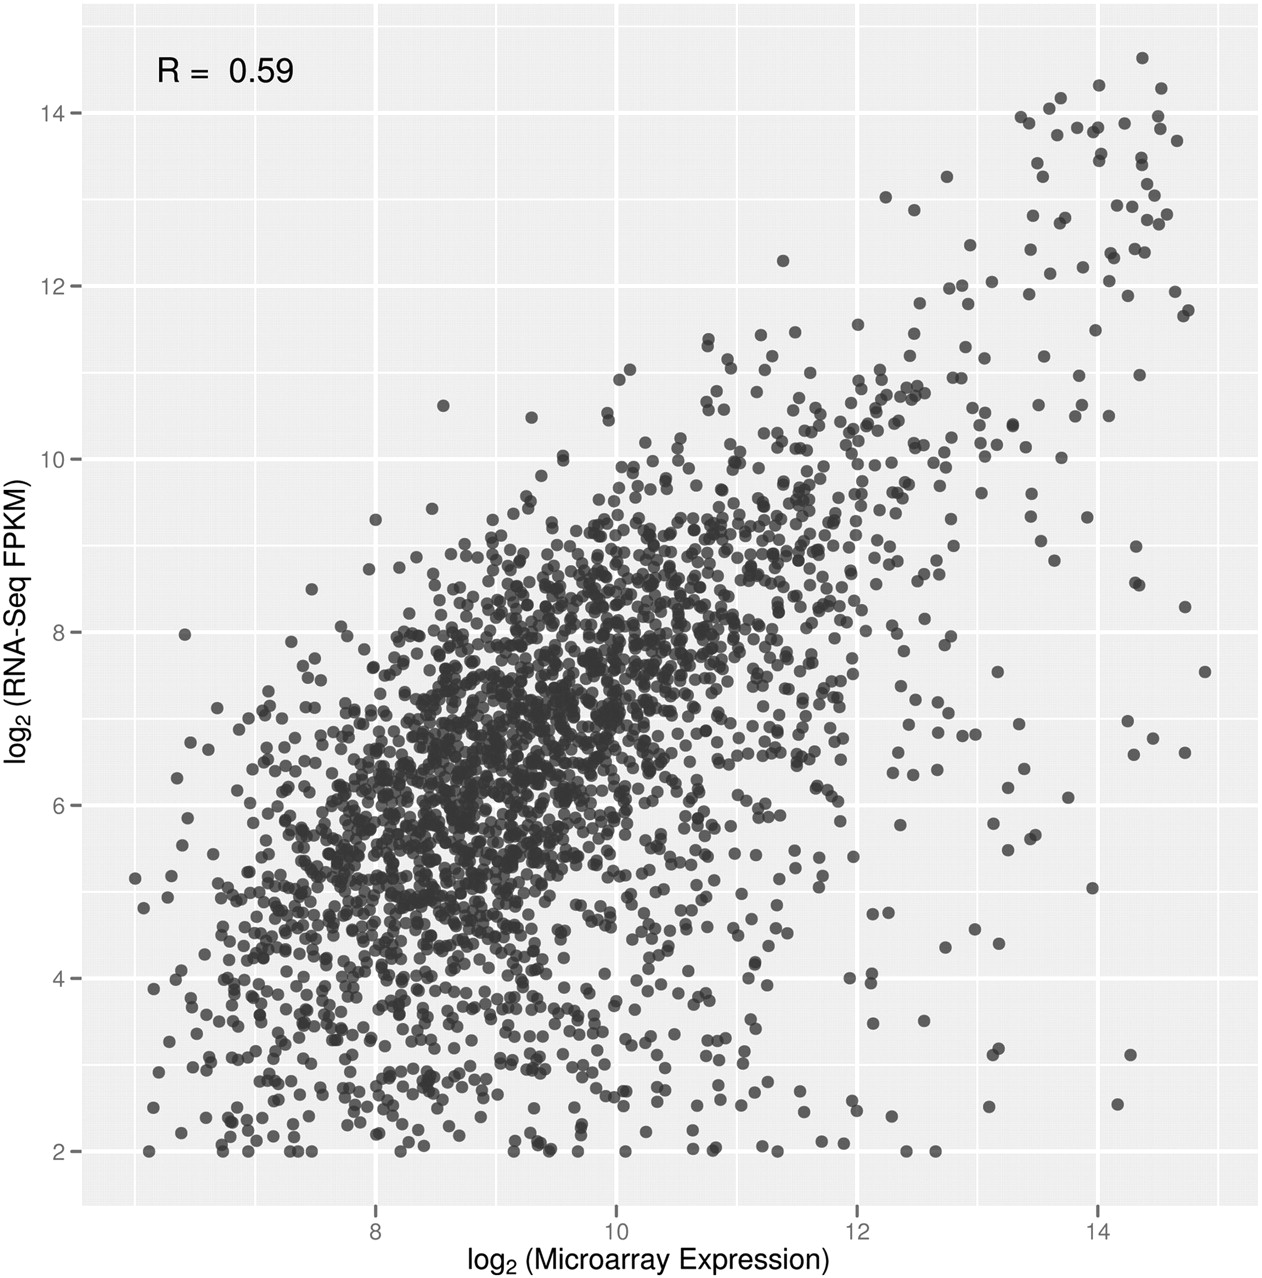
Figure 3.
Expression values from RNA-seq and microarray. Comparison of FPKM values (log2-transformed) and microarray signals for the 2597 genes detected by both platforms in 20 unrelated individuals. For each gene, we plotted the average expression values across the 20 individuals.


