
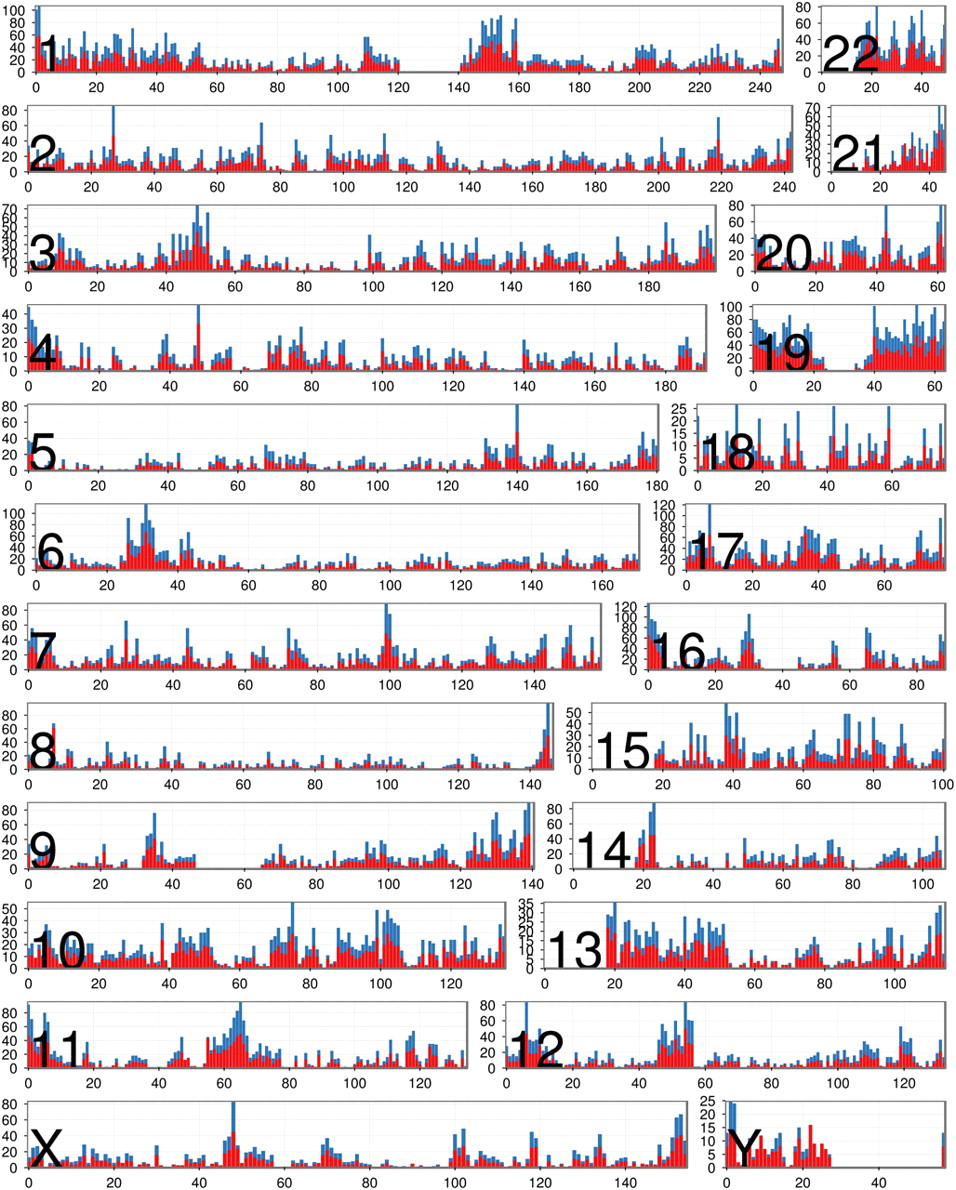
Figure 2.
Distribution of expressed genes by chromosome. For each chromosome, we plotted the number (y-axis) of Gencode genes residing in 1-Mb intervals along the chromosome (x-axis depicts physical distance in megabases). (Red) The number of genes that are expressed (FPKM ≥0.05); (blue) the number that are not expressed.


