
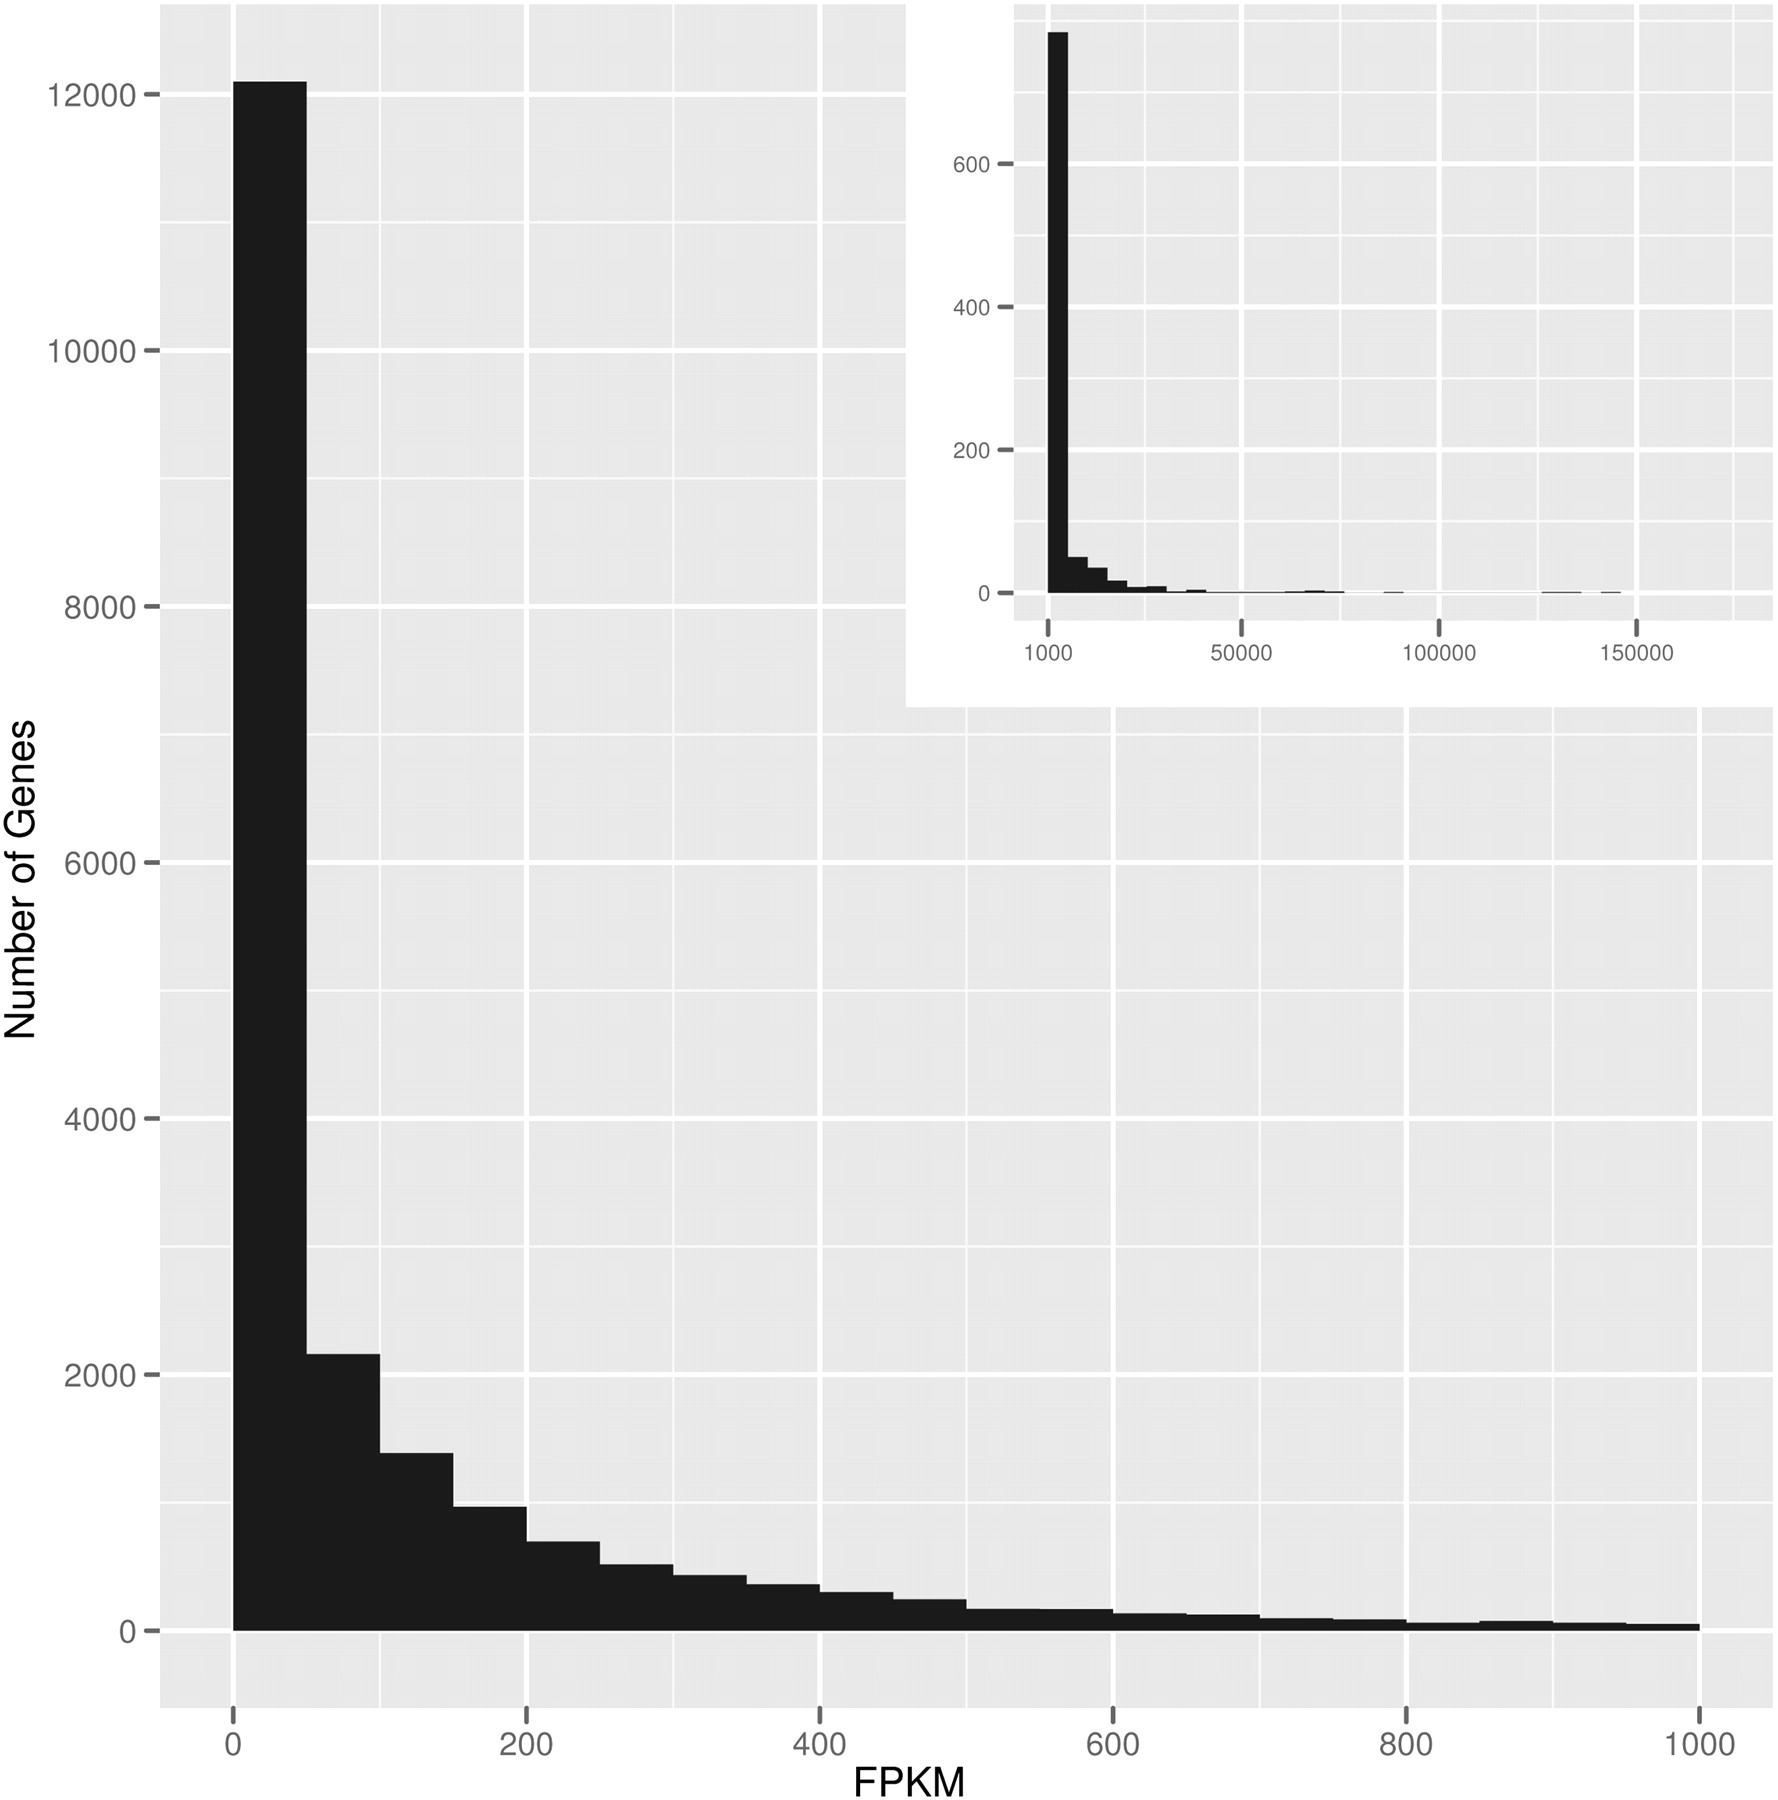
Figure 1.
Distribution of FPKM values for Gencode genes. The distribution of gene expression values is skewed right; the median and mean FPKM values are 26 and 338, respectively. The main figure shows genes with FPKM values less than 1000. (Inset) Genes with FPKM values greater than 1000. For percentiles of FPKM values for genes and transcripts, see Supplemental Tables 2 and 3.


