
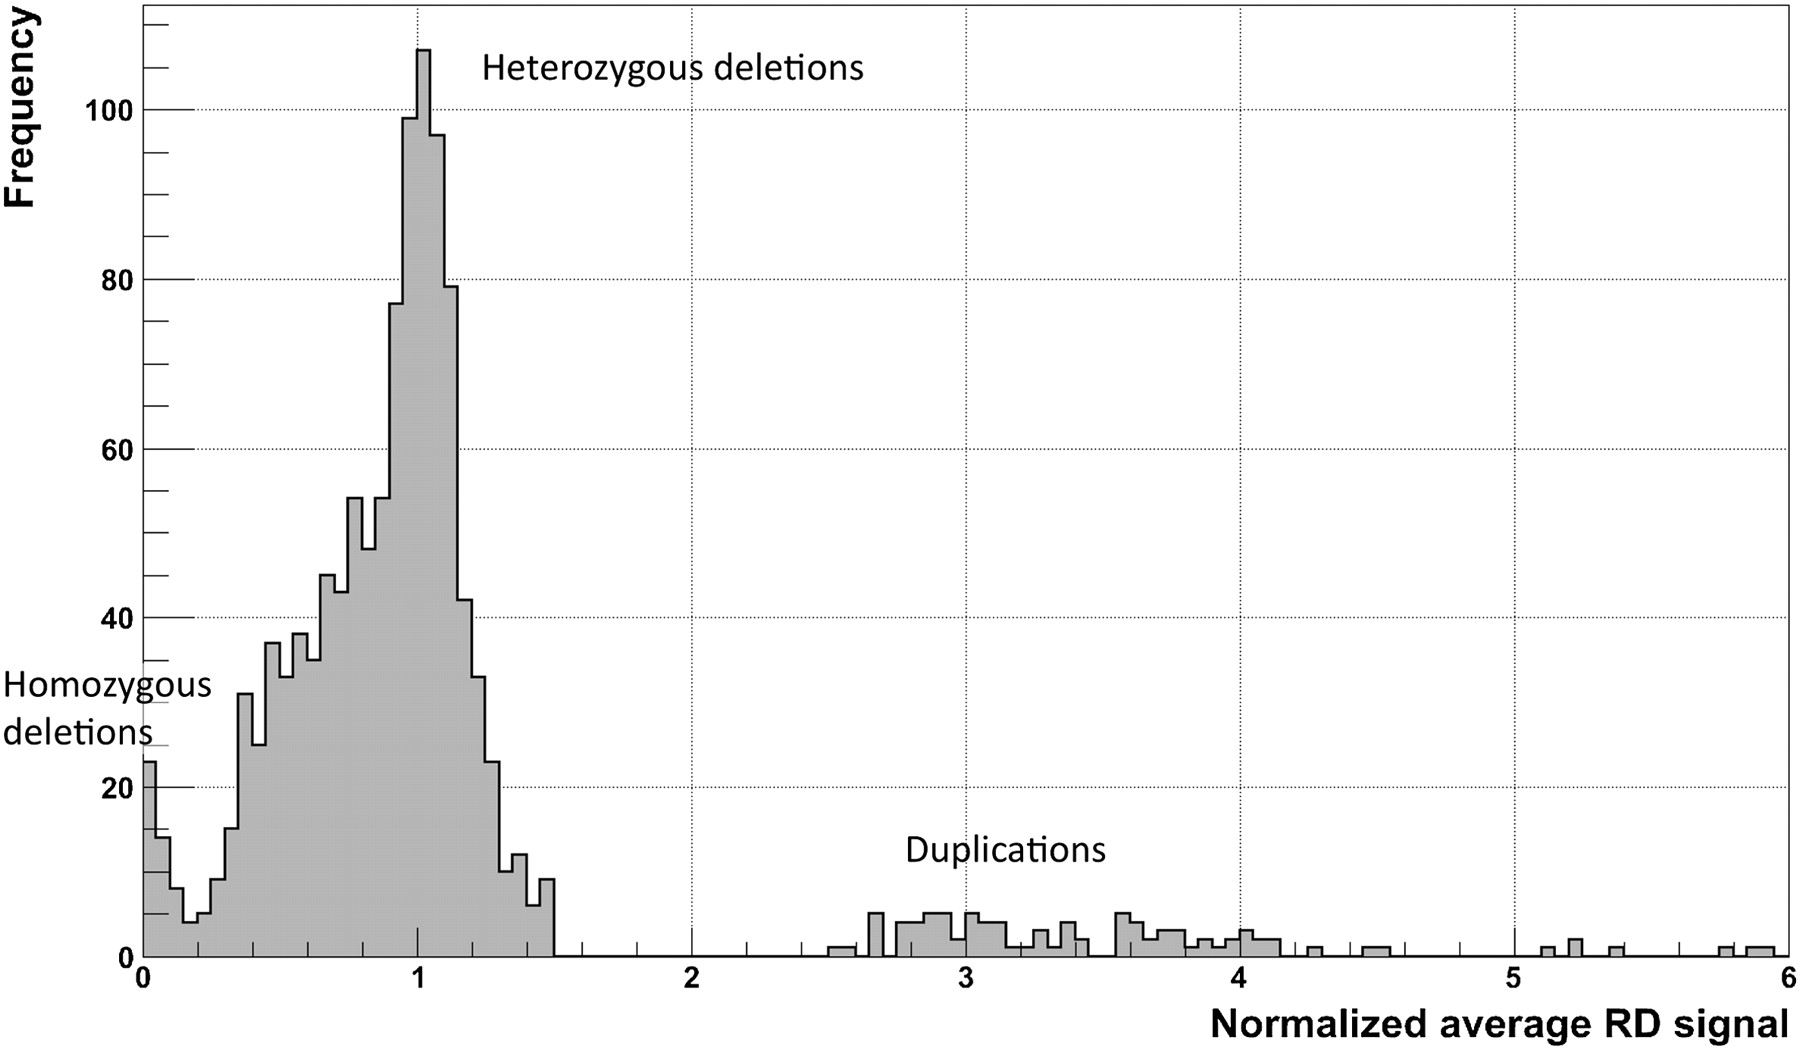
Distribution of normalized average RD signal for predicted CNVs (for a CEPH daughter) that are >1 kb and pass the q0 filter. The normalization factor is the double (two copies of each chromosome) of the genome-wide average RD signal. Two clear peaks (around 0 and 1) correspond to homozygous and heterozygous deletions. Slight displacement of the second peak (∼0.05) from a value of 1 is the result of read over-mapping in those regions, when choosing a mapping location for nonuniquely mapped reads (see Methods). Peaks for duplications are smeared, which reflects the larger variations in the RD signal and, as a consequence, the greater challenge in detecting and genotyping duplications.


