
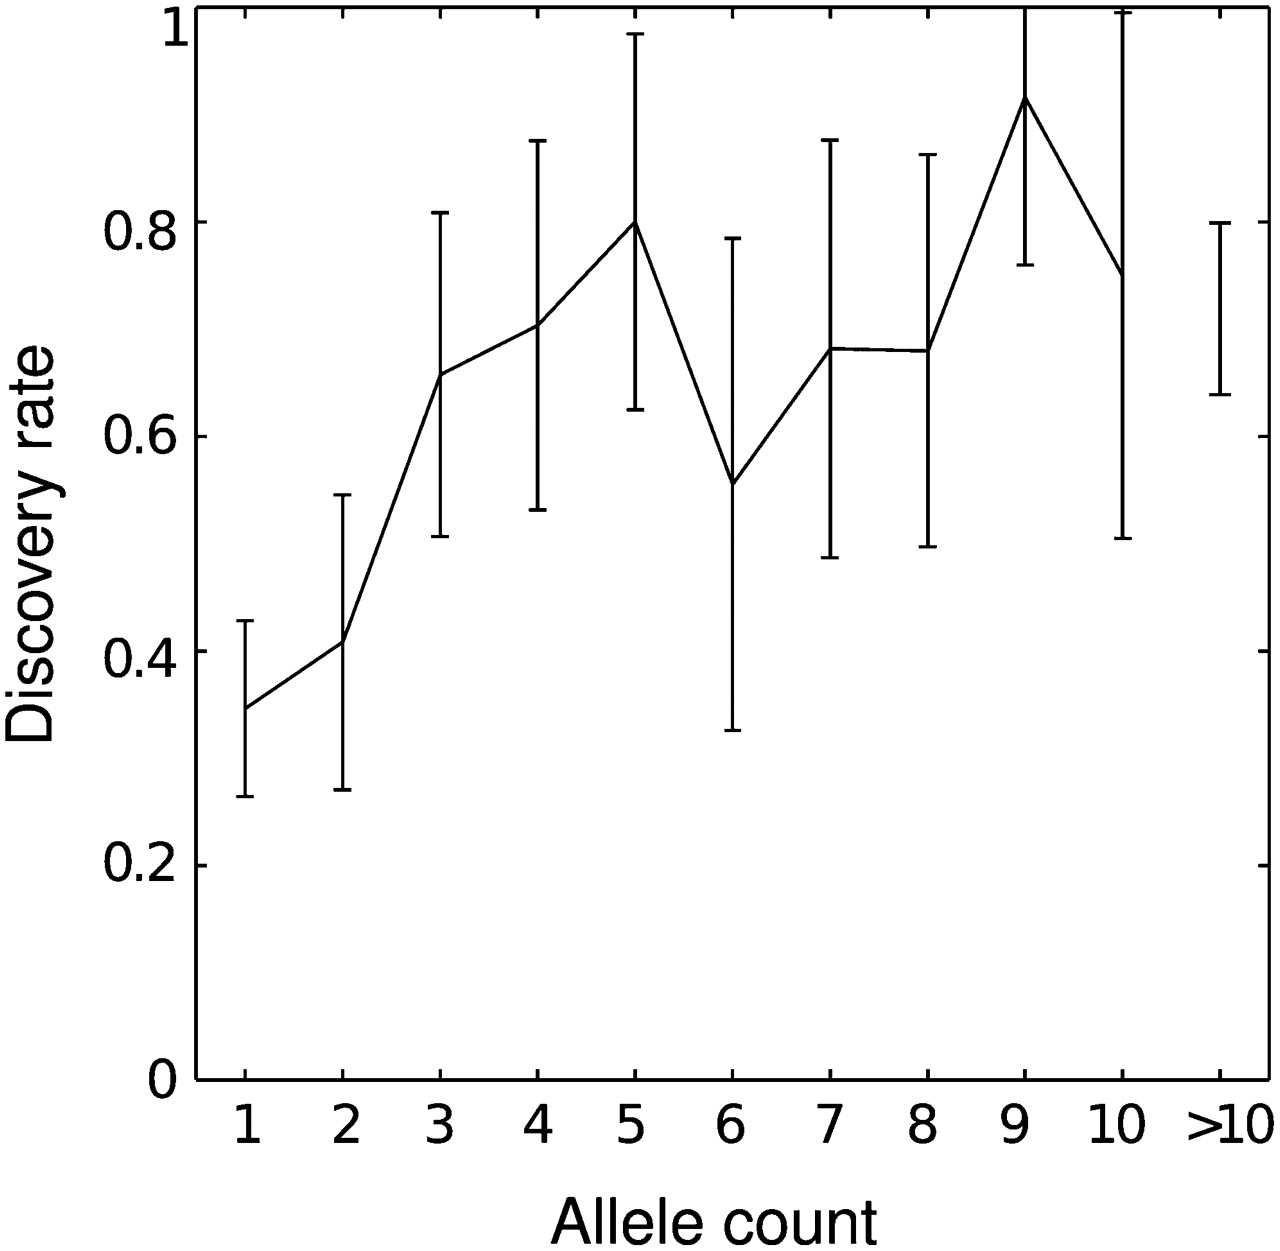
Figure 7.
Discovery rate of SeattleSNP indels from the 1000 Genomes pilot 1 samples with Illumina data (170 individual sequenced at 2.99× on average). The horizontal axis represents the indel allele count in the SeattleSNP data set, the vertical axis the corresponding discovery rate in 1000 Genomes pilot 1 data.


