
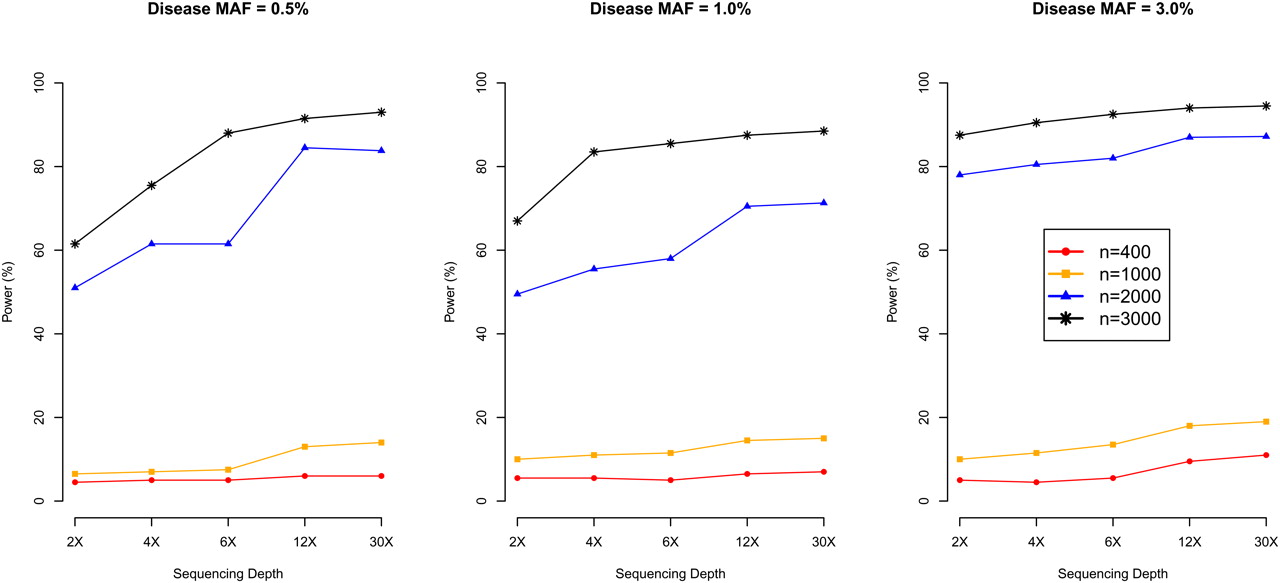
Figure 7.
Power of association mapping by sequencing depth and number of individuals sequenced. We simulated 1500 cases and 1500 controls, assuming a single causal variant with causal allele frequency 0.5%, 1%, or 3%. We sequenced all 3000 individuals or a random subset of 400, 1000, or 2000 individuals (equal number of cases and controls) at depths ranging from 2×–30×. Power was estimated using an empirical threshold determined from 500 null sets to ensure familywise type-I error of 5%.


