
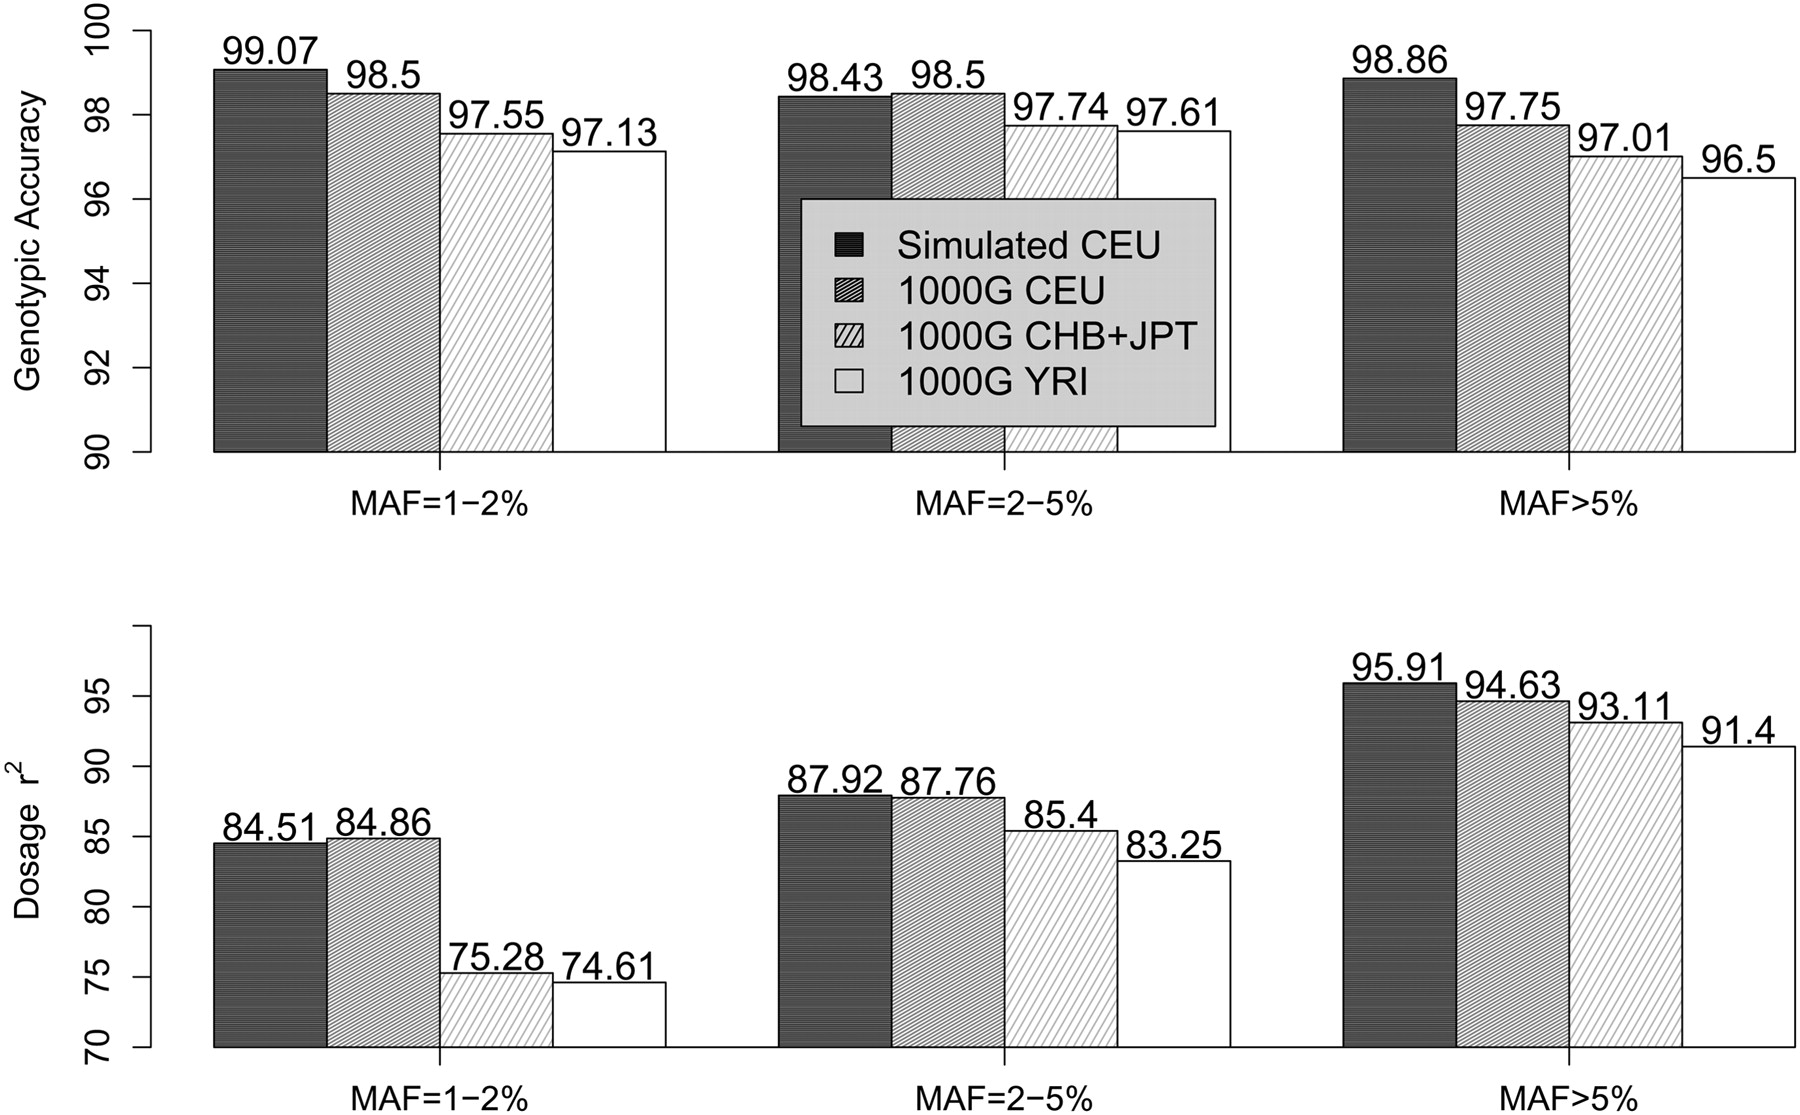
Figure 6.
Genotype calling quality: Simulated versus the 1000 Genomes Pilot 1. Genotype calling quality is gauged by two measures—genotypic concordance and dosage r2—by comparing with true genotypes in simulated data and with experimental genotypes in real data from the 1000 Genomes Low-coverage Pilot Project. For both the real and simulated data, 60 individuals were sequenced at an average depth of 4×. For the 1000 Genomes Pilot 1 data, genotype calling was performed using sequencing data alone without HapMap 3 genotypes.


