
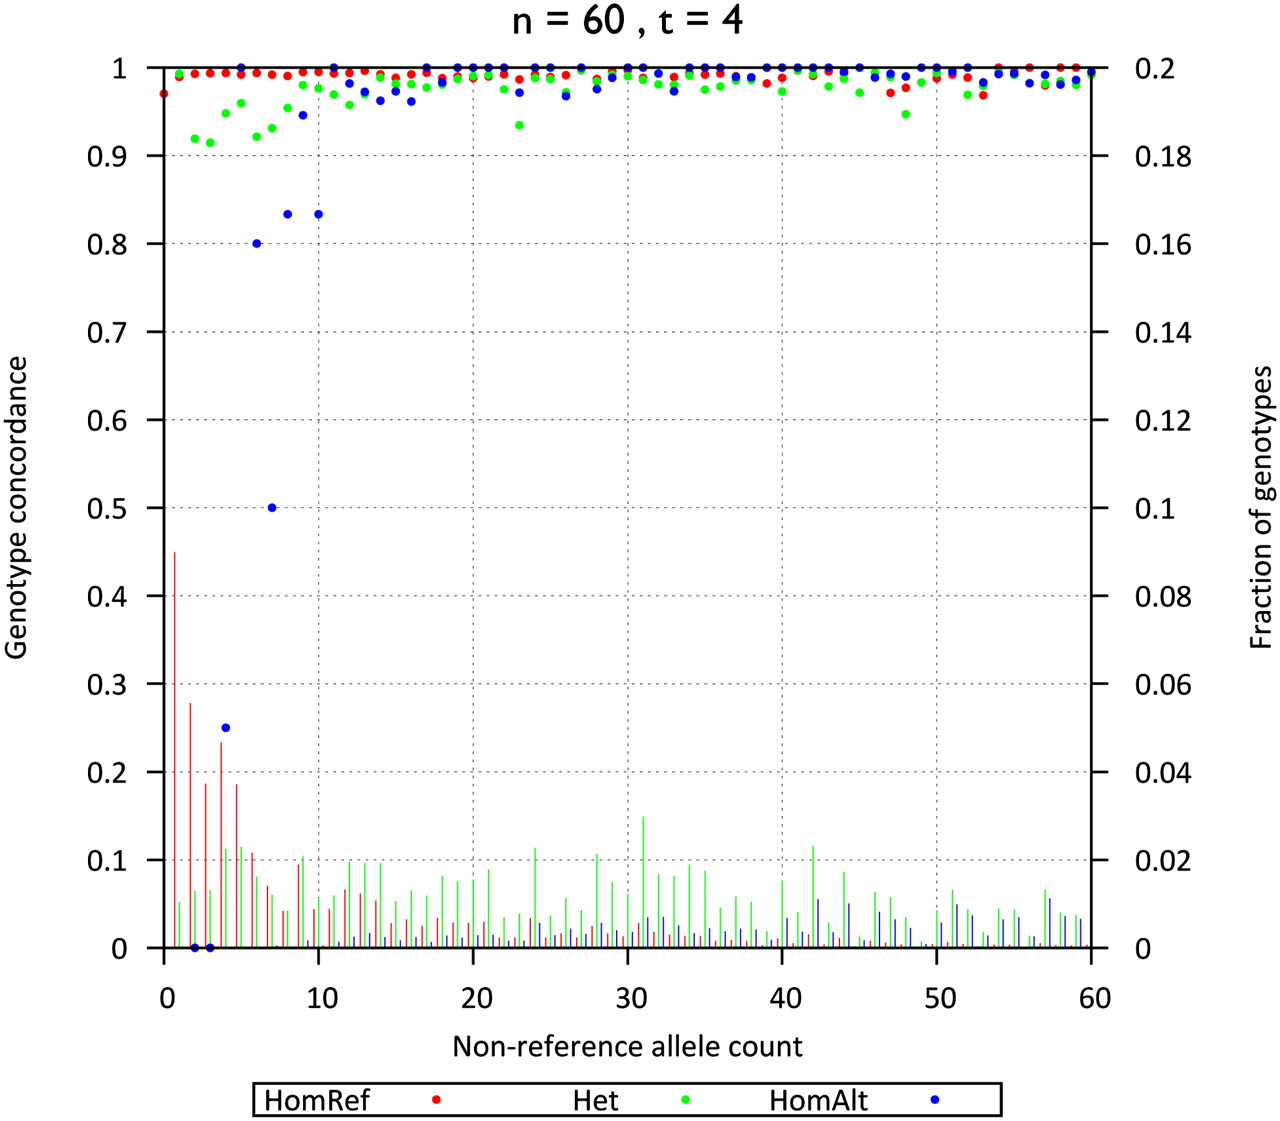
Figure 3.
Genotype concordance and fraction of genotypes by non-ancestral allele counts (60 individuals sequenced at 4×). Genotype concordance (y-axis on left, dots) and fraction of genotypes (y-axis on right, bars) for simulated data, broken down by genotype category (homozygotes for the ancestral allele [HomRef], heterozygotes [Het], and homozygotes for the non-ancestral allele [HomAlt]) are plotted as a function of non-ancestral allele count among 60 individuals sequenced at 4× (x-axis).


