
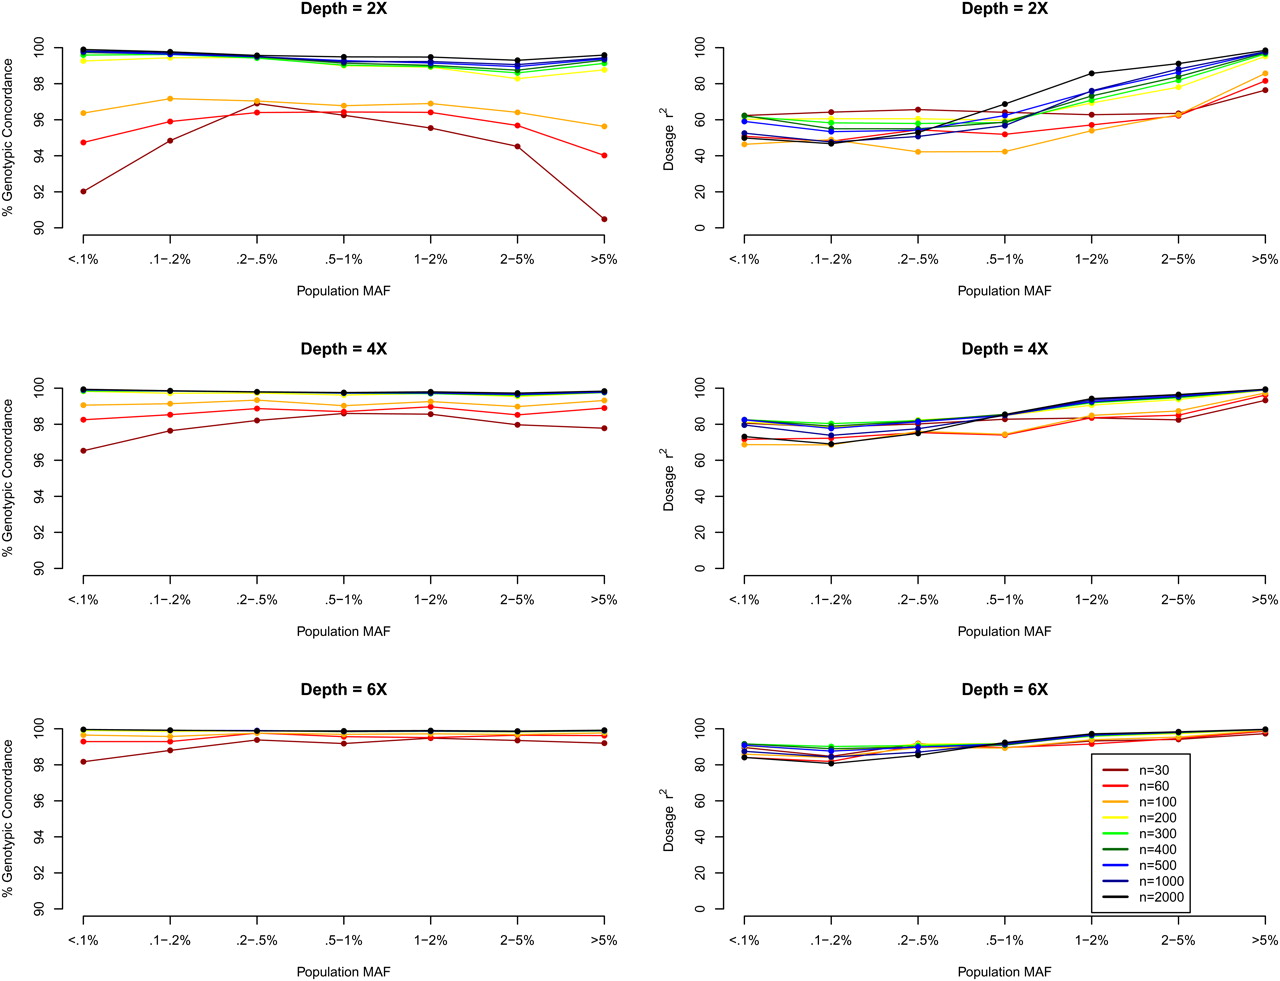
Figure 2.
Genotype calling quality by MAF, sequencing depth, and sequencing sample size. We simulated 30–2000 individuals sequenced at depths 2×, 4×, and 6×. We compared genotype calls at detected SNPs with the simulated truth to obtain two measures of genotype calling quality, genotypic concordance and dosage r2, for each called SNP. We plot these two measures (left panel: genotypic concordance; right panel: dosage r2) by population MAF category (<0.1% to >5%), where population MAF is for the 45,000 simulated chromosomes.


