
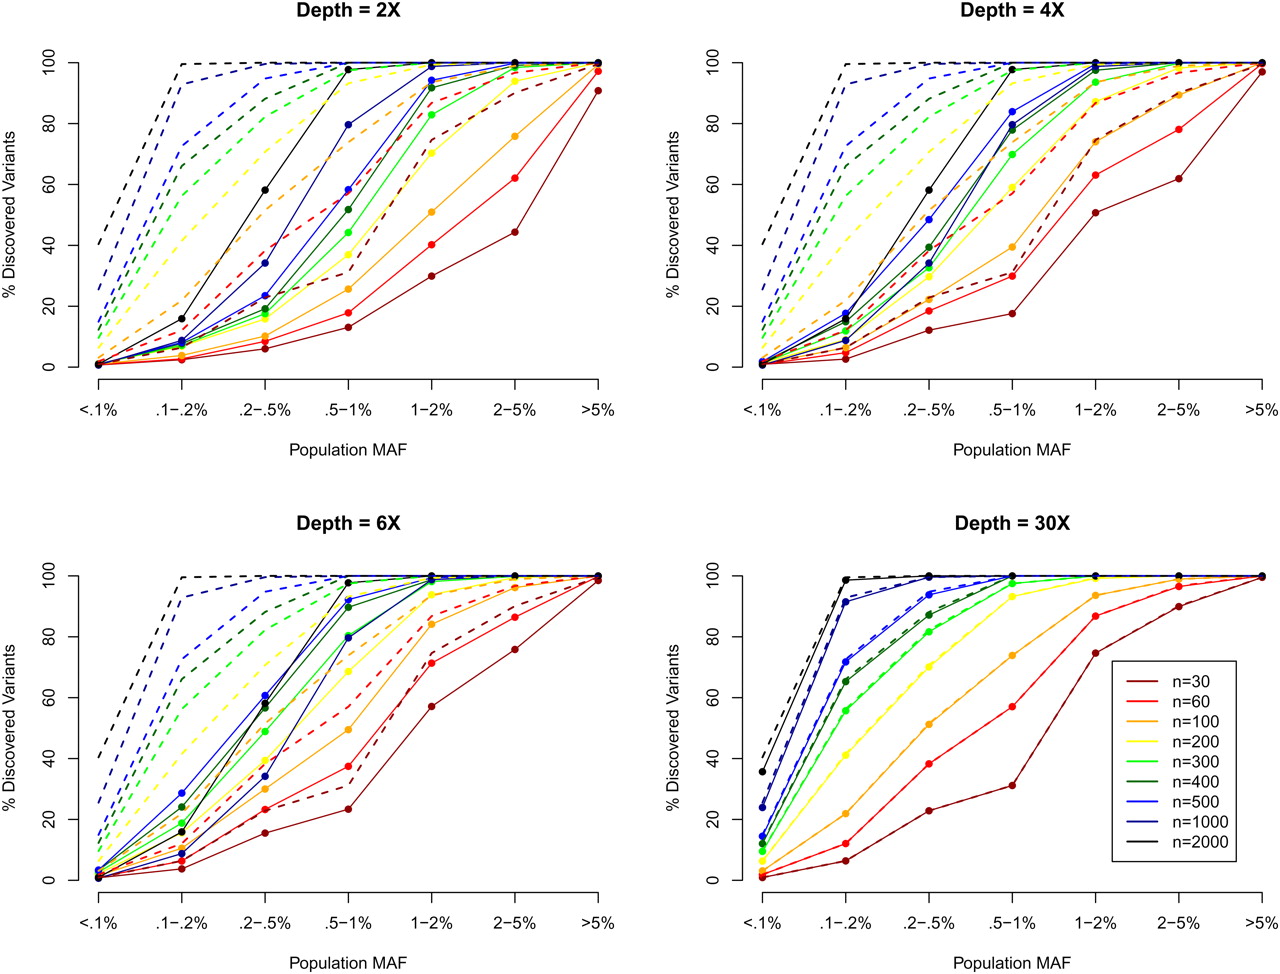
Figure 1.
SNP discovery (%) by MAF, sequencing depth, and sequencing sample size. We simulated 30–2000 individuals sequenced at depths 2×, 4×, 6×, and 30×. We plotted the % of SNPs discovered by population MAF category (<0.1% to >5%), where population MAF is for the 45,000 simulated chromosomes. The dotted lines show the % of SNPs in each population MAF category that is polymorphic among the sequenced individuals.


