
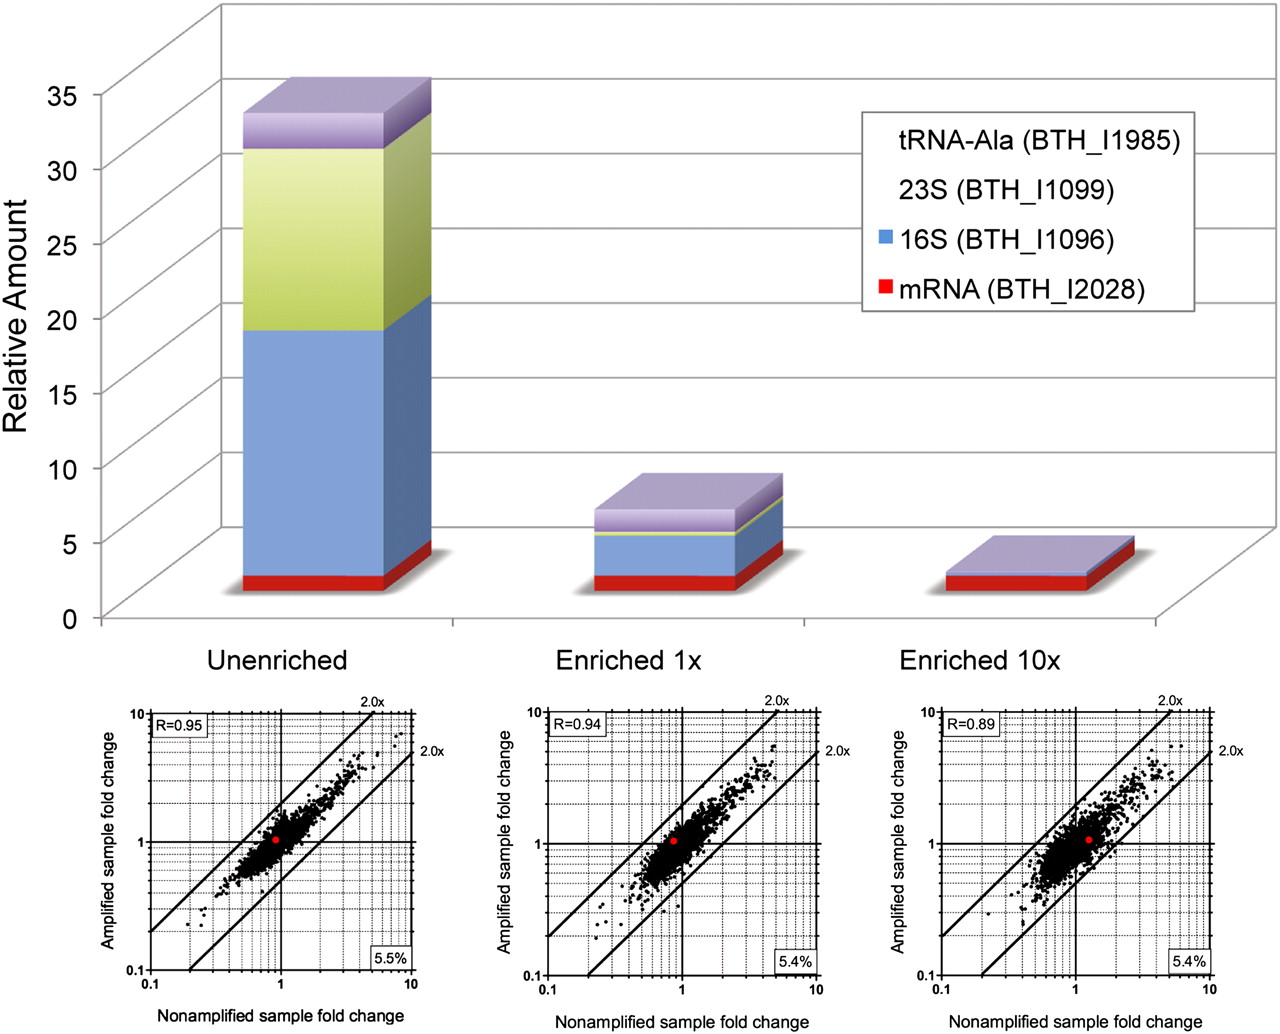
Evaluation of mRNA enrichment in amplified single cell samples. Top panel presents mRNA amount of a gene (BTH_I2028) relative to genes of 16S rRNA, 23S rRNA, and a tRNA-Ala detected by real-time RT-PCR. Unenriched represents amplified sample without the mRNA enrichment step. Enriched (1× or 10×) means treated with 1 × 10⁻⁵ U (as described in Methods) or 1 × 10⁻⁴ U of the Terminator 5′-Phosphate–Dependent Exonuclease, respectively. The relative transcriptional levels of rRNAs and tRNA are significantly higher than the BTH_I2028 gene (mRNA) in the unenriched sample but are greatly reduced in the enriched samples. Microarray analysis was performed for amplified samples (enriched and unenriched); fold-changes were compared to nonamplified samples as shown in the bottom plots. Fold-change correlation for the BTH_I2028 gene is indicated by the red dots. The number at the bottom right corner represents the percentage of transcripts that were missing in the single cell. Enrichment with 10× the amount of 5′-phosphate–dependent exonuclease resulted in a slightly higher fold-change bias as indicated by the Pearson correlation coefficient shown at the upper left corner for each plot.


