
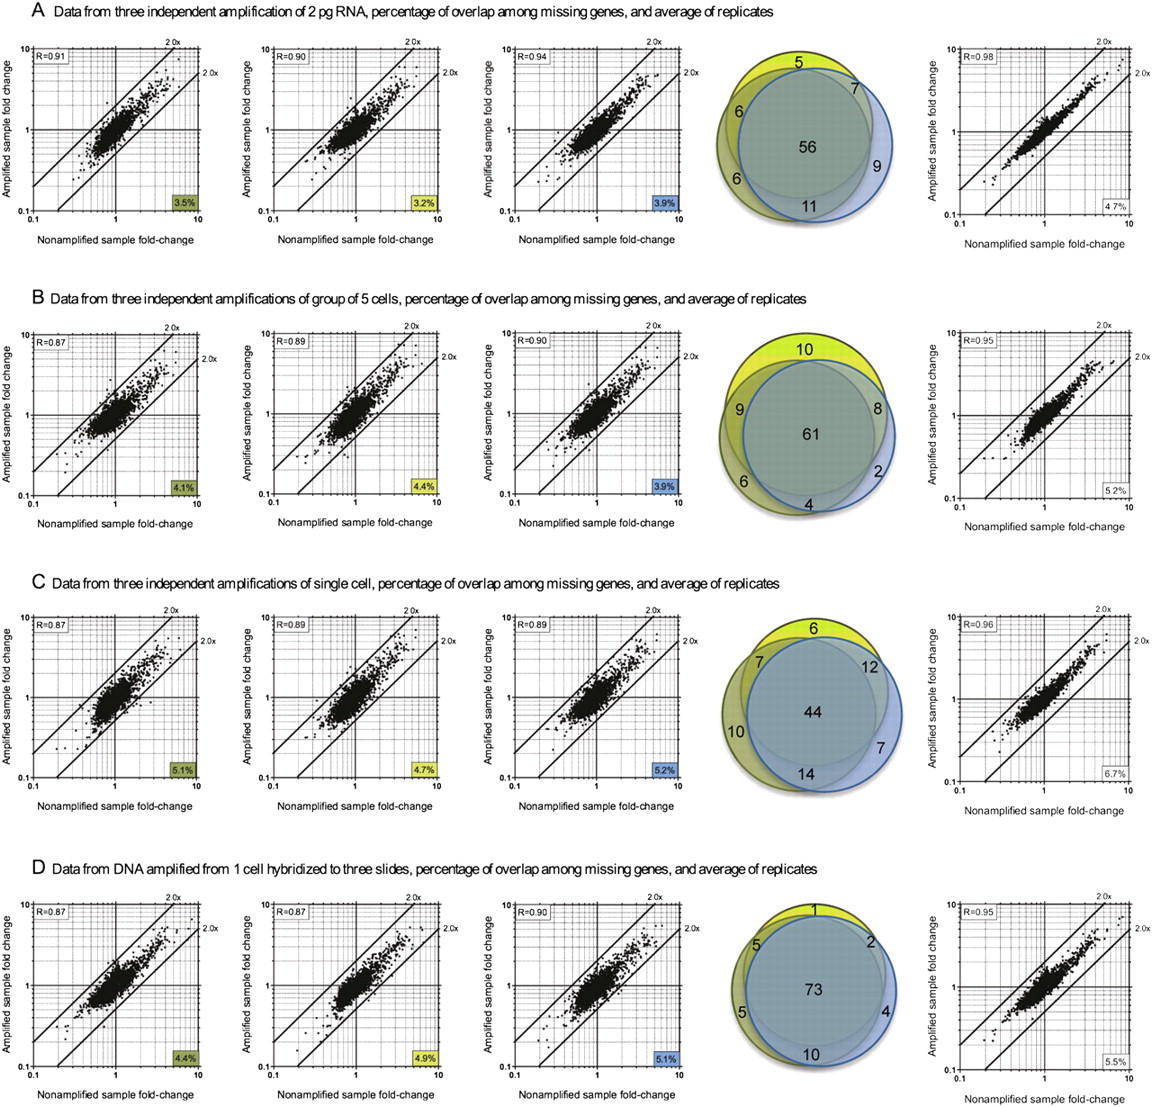
Microarray data fold-change comparison of nonamplified and amplified samples starting from 2 pg of diluted RNA (A), five cells (B), or one cell (C) as biological replicates; or a single cell hybridized to three different slides as technical replicates (D). The first three plots of each item are biological replicates (A–C) or technical replicates (D). The number in the bottom right corner of each plot indicates the percentage of genes that were missing in the amplified samples compared to the nonamplified samples. The Pearson correlation coefficient between the amplified and nonamplified fold-change data is shown at the upper left corner of each plot. The high correlation coefficient values (P < 0.0001) and the tight grouping of the dots within the twofold difference boundaries suggest a relatively low bias. The percentages of overlap among missing genes from each group are displayed as area-proportional Venn diagrams of three independent biological (A–C) or technical replicates (D). The color for each circle in the Venn diagram corresponds to the colored boxes in each scatter plot. The last plot of each item shows averaged data from the three biological (A–C) or technical replicates (D). All microarray experiments in this figure were performed without the optional mRNA enrichment step.


