
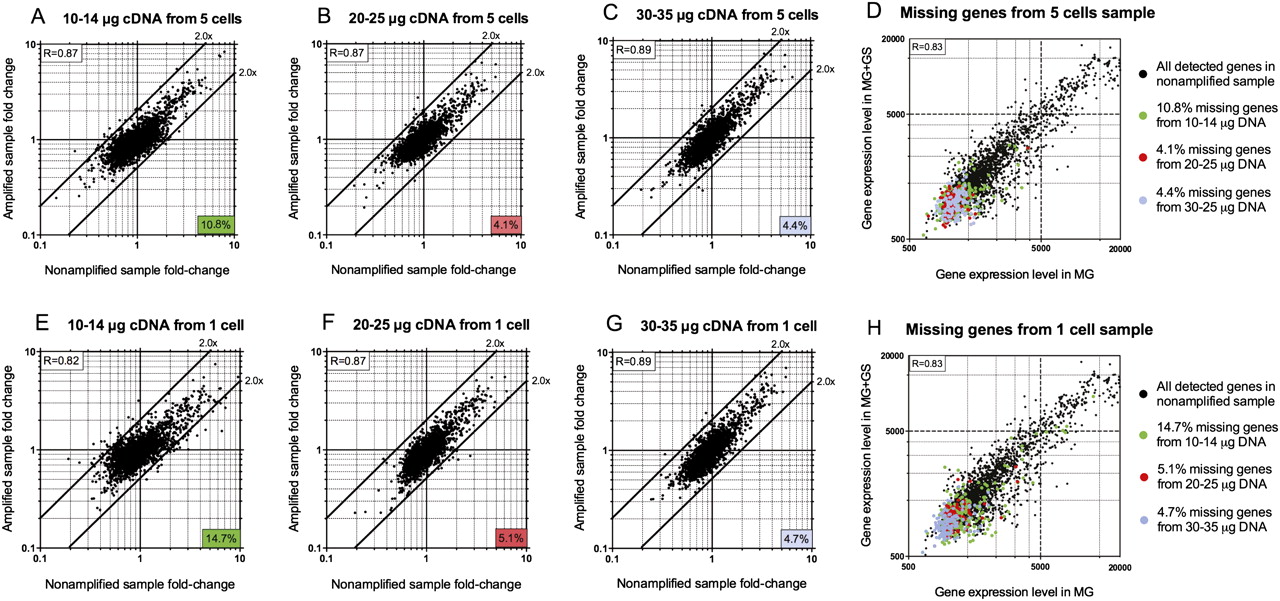
Fold-change scatter plots of expressed genes obtained from nonamplified versus amplified samples. 10–14 μg (A), 20–25 μg (B), or 30–35 μg (C) of DNA amplified from five-cell samples were hybridized to different slides, and the fold-changes of detected genes were plotted against those obtained from the nonamplified sample. The number located at the right bottom corner of each plot indicates the percentage of missing genes (drop-outs) from each amplified sample compared with the nonamplified sample (2842 genes total). (D) Gene expression levels from the nonamplified sample (black dots) were compared between two growth conditions (MG ± 0.01% GS). Expression levels of genes that were missing in the five-cell amplified samples are colored green (as a result of using 10–14 μg of cDNA), red (using 20–25 μg of cDNA), or purple (using 30–35 μg of cDNA), and are overlaid on the same graph in D. Similar comparisons were conducted with different amounts of cDNA amplified from one-cell samples: 10–14 μg (E), 20–25 μg (F), or 30–35 μg (G). Missing genes or drop-outs from each sample were color-coded similarly and overlaid with the total number of genes detected in the nonamplified samples (H). The R value in the upper left corner of each plot represents the Pearson correlation coefficient. All microarray experiments in this figure were conducted without the optional mRNA enrichment step.


