
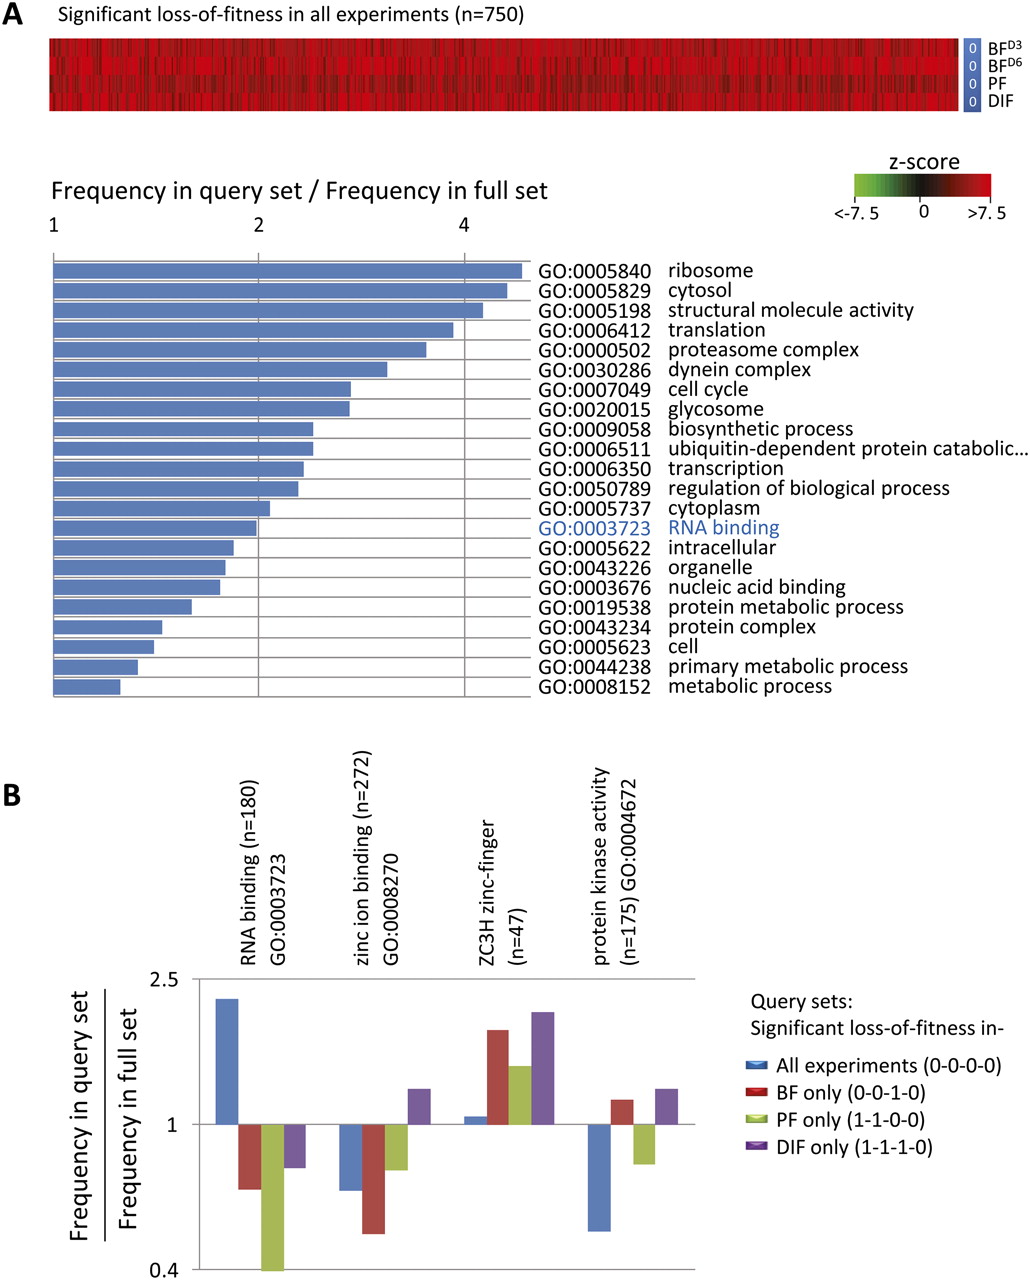
Genetic profile for genes associated with loss-of-fitness in all four RNAi-induced experiments. (A) Genes in the 0-0-0-0 group are presented as a Z-score heat-map above the associated GO-term profile. All highly significant (P < 0.01) associations from the GO-slim set are shown. See Supplemental File 2 for full GO-term analysis. The term shown in blue is analyzed in more detail in B and discussed in the text. (B) Distribution of cohorts of genes potentially associated with post-transcriptional control of gene expression. GO terms were used to extract GeneID lists from TritrypDB. See Supplemental File 1B for ZC3H GeneIDs. Binary coding is as described in the legend to Figure 4D.


