
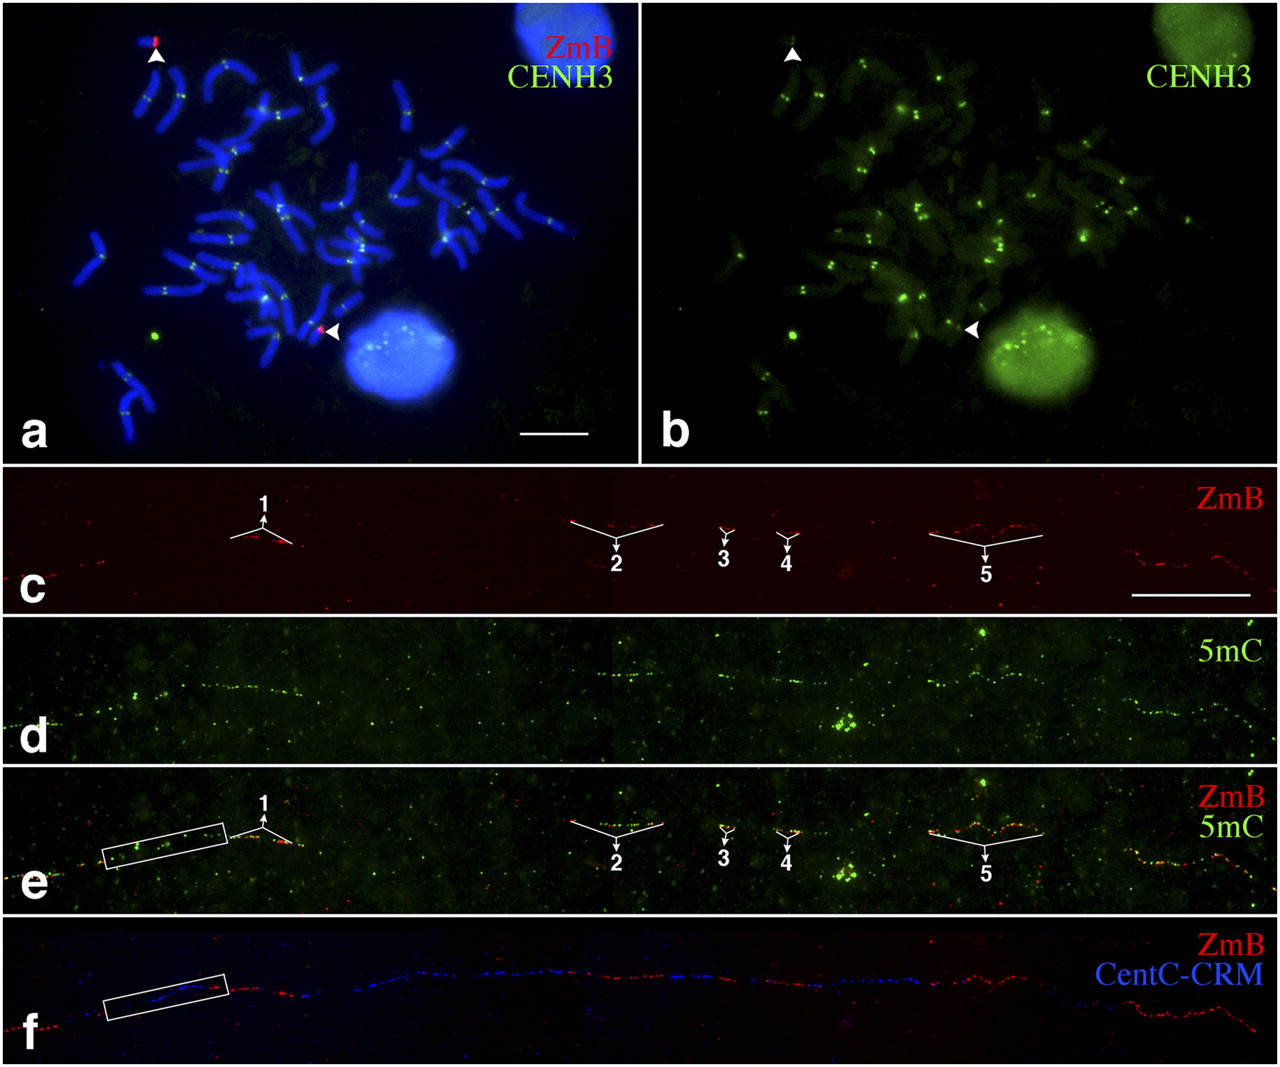
Mapping of DNA methylation in the centromere of a maize B chromosome in an oat genetic background. (a) A metaphase cell, derived from the oat–maize B chromosome addition line, was analyzed with an immunofluorescence assay using a maize anti-CENH3 antibody combined with FISH using a ZmB probe. The arrowheads point to the two B chromosomes. Bar, 10 μm. (b) Digitally separated CENH3 signals from the immunofluorescence assay. Arrowheads point to the CENH3 signals from the B chromosomes. (c) Fiber-FISH signals from the ZmB repeat located in the B chromosome in an oat genetic background. Bar, 20 μm. (d) Detection of 5mC on the same DNA fiber as c. (e) A merged image of the ZmB and 5mC signals. The region immediately flanking the first ZmB array is boxed and shows a similar methylation level as the ZmB arrays. (f) Fiber-FISH signals derived from ZmB (red) and a mixed probe with both CentC and CRM sequences (blue). The box, which covers the same region as in e, includes CentC-CRM sequences.


