
Stable and dynamic nucleosome states during a meiotic developmental process
- 1Center for Eukaryotic Gene Regulation, Department of Biochemistry and Molecular Biology, Pennsylvania State University, University Park, Pennsylvania 16802, USA;
- 2The Integrative Biosciences Graduate Program in Cell and Developmental Biology, Huck Institutes of the Life Sciences, Pennsylvania State University, University Park, Pennsylvania 16802, USA;
- 3Department of Biology, Pennsylvania State University, University Park, Pennsylvania 16802, USA; State Key Laboratory of Genetic Engineering, Institute of Plant Biology, School of Life Sciences, Institutes of Biomedical Research, Fudan University, Shanghai 200433, China
Abstract
The plasticity of chromatin organization as chromosomes undergo a full compendium of transactions including DNA replication, recombination, chromatin compaction, and changes in transcription during a developmental program is unknown. We generated genome-wide maps of individual nucleosome organizational states, including positions and occupancy of all nucleosomes, and H3K9 acetylation and H3K4, K36, K79 tri-methylation, during meiotic spore development (gametogenesis) in Saccharomyces. Nucleosome organization was remarkably constant as the genome underwent compaction. However, during an acute meiotic starvation response, nucleosomes were repositioned to alter the accessibility of select transcriptional start sites. Surprisingly, the majority of the meiotic programs did not use this nucleosome repositioning, but was dominated by antisense control. Histone modification states were also remarkably stable, being abundant at specific nucleosome positions at three-quarters of all genes, despite most genes being rarely transcribed. Our findings suggest that, during meiosis, the basic features of genomic chromatin organization are essentially a fixed property of chromosomes, but tweaked in a restricted and program-specific manner.
Virtually all aspects of chromosome biology are rooted in chromatin structure, which includes nucleosome organization and modification states. Yet, it is not known to what extent individual nucleosomes and modification states across a genome reorganize as chromosomes undergo a wide range of transactions from the unfurling of developmental transcription programs to DNA replication, recombination, chromosome segregation, and genome compaction. Gametogenesis (spore formation) in budding yeast Saccharomyces cerevisiae is a model system to study fundamental cellular mechanisms of development as well as large-scale genomic transactions (Krishnamoorthy et al. 2006; Govin et al. 2010; Handel and Schimenti 2010). Recent technological advances in high-throughput DNA sequencing have allowed genome-wide nucleosome organization to be determined at the individual nucleosome level. We therefore examined nucleosome organization and modification states, as yeast cells are reprogrammed from exponential growth in rich media to a starvation state and then allowed to proceed through meiosis and on to spore formation.
In mitotically growing haploid yeast cells, nucleosomes are typically spaced ∼165 bp apart (Yuan et al. 2005). In a population of cells, nucleosomes tend to be well-positioned at the 5′ ends of genes and become less positioned (or “fuzzy”) toward the 3′ ends (Yuan et al. 2005; Mavrich et al. 2008). Most genes have a similar chromatin architecture including a “−1” nucleosome upstream of the core promoter, a nucleosome-free promoter region (5′ NFR), a +1 nucleosome that is positioned to control access of the transcriptional start site (TSS), and an array of nucleosomes beginning at the +1 position and ending at a 3′ NFR (Jiang and Pugh 2009). Superimposed on this organizational state are a variety of histone modifications that tend to be enriched at specific regions along genes (Liu et al. 2005; Barski et al. 2007). A fundamental unanswered question is how plastic this basic organizational theme is.
Transcriptional responses to environmental signals typically entail nucleosome reorganization at reprogrammed genes (Hogan et al. 2006; Schones et al. 2008; Shivaswamy et al. 2008; Kaplan et al. 2009). Much of the remaining genome remains unaltered. However, the resolution of the methods used and the limited perturbations to the system precluded definitive assessment as to whether the primary structure of chromatin can undergo massive reorganization when entire chromosomes are subjected to a full gamut of transactions, such as that occurring during meiosis and spore formation where the chromatin is compacted (Kleckner 1996). Although several studies on a few classical double-stranded break (DSB) hotspots indicate that the chromatin structure of these sites does not detectably change as cells progress through the meiosis (Ohta et al. 1994; Fan and Petes 1996; Borde et al. 1999), it is not known whether this is generalizable. Importantly, low-resolution assays are unable to track short-distance nucleosome repositioning that can have profound effects on the accessibility of specific DNA regulatory elements.
With both the 5′ and 3′ NFRs typically large enough to accommodate a nucleosome, and linker regions between nucleosomes being ∼18 bp, ∼20% of the genome is essentially nucleosome-free (Lee et al. 2007; Shivaswamy et al. 2008). Global transcription rates decrease during sporulation (Jona et al. 2000). Since nucleosome occupancy in NFRs has been attributed to transcriptional shutdown (Schones et al. 2008; Shivaswamy et al. 2008), NFRs might be expected to acquire nucleosomes during the sporulation program. In addition, the ensuing compaction might also involve nucleosome acquisition in NFRs and internucleosomal spacing changes (Routh et al. 2008; Segal and Widom 2009). Compaction might also be expected to increase nucleosome positioning as the degrees of freedom for positioning become more restricted by interchromatin contacts. As far as we know, no study has addressed the issue of the primary nucleosome organizational state as chromosomes proceed through major transactions during a developmental program such as sporulation, at a resolution sufficient to evaluate individual nucleosome positions, occupancy levels, and modification states.
Results
The primary organization of chromatin remains fixed during meiosis and upon compaction
Two biological replicates of MNase-treated nucleosomal DNA, prepared from cells grown in rich (YPD) medium and from cells starved for fermentable carbon and nitrogen for 0, 2, 5, 7, and 24 h were subjected to whole-genome sequencing (ABI [Life Technologies] SOLiD), producing ∼4.7 million nucleosomal sequence tags per sample (∼79 tags per nucleosome position, Supplemental Table S1). The progression from stationary phase (which is defined in this study as the conditions used at 0 h—see Methods), through meiosis, and on to spore formation was monitored by flow cytometry and DAPI staining analysis. Approximately 95% of the cells had formed spores by 24 h (Supplemental Fig. S1), indicating that the observed nucleosome organization (see Fig. 1A) was not due to unsporulated cells. Equivalent levels of mononucleosomes were extracted at each time point, including during spore formation, with very little remaining unextracted (Supplemental Fig. S2), indicating that no significant subpopulation was left behind. All mononucleosome preparations were dependent upon addition of exogenous MNase (Supplemental Fig. S2B), which demonstrates that endogenous nucleases were not contributing to the nucleosome pattern. Moreover, since equivalent amounts of MNase applied to nucleosomes reconstituted on genomic DNA failed to produce the same pattern (Zhang et al. 2009), these patterns were not an artifact of sequence-specific cleavage preferences of MNase.
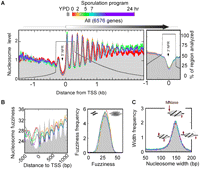
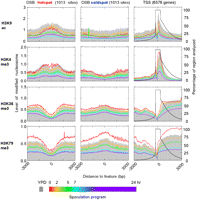
Nucleosome organization around genes throughout sporulation. (A) Composite nucleosome distribution traces for six time points in the meiosis/sporulation program are color-coded as indicated. Nucleosome midpoint density is represented by sequencing tag counts from cross-linked, MNase-digested, H3 immunoprecipitated, and gel-purified samples. Distributions were normalized such that the total tag count in each sample was equal. Tag counts are distributed about 6576 transcript start (TSS) and end (TES) sites in 3-bp bins and 15-bp bins, respectively, and smoothed via a three-bin moving average. The percentage of regions analyzed is indicated by the black trace and covers a minimum of ±300 bp from the TSS or TES and a maximum of 300 bp from the next TSS or TES. Bin counts were normalized to the number of regions represented in each bin. (B) Nucleosome fuzziness was taken to be the standard deviation of tag locations for each nucleosome. The average fuzziness per bin was determined, then plotted as described in A. (Right) A frequency distribution of nucleosome fuzziness at various meiotic time points. Color codes are as in A, except that YPD is represented by a black trace. (C) Frequency distribution of nucleosomal widths (distance between the W/+ and C/− MNase-digested borders).
Since an H3 amino-terminal tail endopeptidase has been reported present in nuclear extracts prepared from stationary phase and sporulating cells (Santos-Rosa et al. 2009), we used H3 antibodies directed against the C-terminal region of H3 in all experiments. However, we did not detect cleavage of H3 in vivo at any time (Supplemental Fig. S3).
Sequencing tags from H3-immunopurifed nucleosomes were plotted as a frequency distribution around all annotated transcription start sites (TSS) and end sites (TES) as composite plots (Fig. 1A) and as a cluster plot of individual genes (Supplemental Fig. S4A). Tag counts were normalized to eliminate the bulk increase in histone occupancy levels that accompanied DNA replication at the start of meiosis. A total of 6576 transcription units were analyzed, covering virtually the entire yeast genome. The resolution of the maps was sufficiently high to identify individual nucleosomes and linkers and changes in their positions, occupancy levels, and modification states.
Strikingly, at no stage, from exponential growth in rich media to stationary phase in starvation media, through meiosis and sporulation, did the bulk of the NFRs acquire nucleosomes, as might be expected if any higher-order genome compaction was manifested at the primary structure of chromatin. This was evident in composite plots of all genes (Fig. 1A) as well in cluster plots of individual genes (Supplemental Fig. S4A) and stands in contrast to a recent low-resolution study purporting loss of 3′ NFRs upon carbon starvation (Fan et al. 2010). We cannot, however, rule out the possibility of partial or remodeled nucleosome assembly, which would not produce ∼150-bp MNase-resistant fragments.
Nucleosome spacing remained constant at 165 bp, with the exception of stationary phase (0 h, red trace). In this case, genic nucleosomes increased their spacing. This shift was reproducible, as it was seen in individual replicates as well as in the histone modification state maps. The origins and functional significance of this stationary phase-specific shift predominating in the middle of genes is unclear. ATP-dependent chromatin remodeling enzymes such as Isw1 have been shown to operate in such regions (Tirosh et al. 2010), and thus might contribute to altered spacing.
There was no widespread repositioning of nucleosomal arrays near the TSS when compared with the pattern obtained from cells grown in rich media. Nucleosome fuzziness (standard deviation of tag distances from a consensus nucleosome midpoint) and width (distance between MNase-defined borders) were essentially unaltered from the pattern in rich media (Fig. 1B,C). This was surprising because nucleosome fuzziness that increases toward the 3′ ends of genes might be expected to reflect translational fluidity of the nucleosomes on DNA, and that higher-order chromatin compaction would be expected to constrain such fluidity. However, such reduction in fuzziness was not observed.
We next focused on specific classes of genomic features that undergo significant changes in activity when cells go from a mitotically active to a quiescent state and then on through meiosis and sporulation. Hotspots and coldspots of double-strand breaks (DSB) in meiotic recombination have been identified on a genomic scale (Gerton et al. 2000; Blitzblau et al. 2007; Buhler et al. 2007; Borde et al. 2009). Hotspots were constitutively depleted of nucleosome, and coldspots had constitutively high occupancy before, during, and after meiosis (Fig. 2A). This has been observed before at the ARG4, CYS3 locus (Ohta et al. 1994; Wu and Lichten 1994) and globally by FAIRE analysis (Berchowitz et al. 2009), but not previously documented on a genomic scale with high-resolution nucleosome maps. Thus, recombinational hotspots have a chromatin structure that is fixed and open at all time points tested in this study.
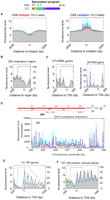
Nucleosome organization around genomic features throughout sporulation. (A–F) Nucleosomal midpoint tags were distributed around the indicated number of genomic features as described in Figure 1, except that bins were 15 bp. Percentages of regions analyzed are on the right.
DNA replication origins also displayed no change in nucleosome occupancy or positioning throughout the meiotic timecourse (Fig. 2B). The RNA polymerase (Pol) III–transcribed tRNA and 5S rRNA genes, the Pol-I transcribed rDNA locus (RDN37-1), and the 131 Pol II–transcribed ribosomal protein (RP) genes, which are all highly transcribed in rich media and down-regulated during stationary phase and meiosis (Chu et al. 1998), remained constitutively nucleosome-free in their promoter regions (Fig. 2C–E). In most cases, the NFR was large enough to accommodate two nucleosomes (>300 bp), but filling-in was not observed.
Nevertheless, transcription-coupled nucleosome depletion within genes transcribed in rich media was returned to high-occupancy states in accord with transcriptional shut-down. Reciprocally, meiotically induced transcription units saw a decrease in nucleosome occupancy during the appropriate induction stage (Fig. 2F; Supplemental Figs. S5, S6). In many cases nucleosome depletion was transient (e.g., SPO74 and HOP2 in Supplemental Fig. S6), while the associated mRNA was stable.
Selective repositioning of the +1 nucleosome over the TSS is linked to gene regulation
Recent studies suggest that the position of the +1 nucleosome may be cell cycle regulated (Kelly et al. 2010). We therefore identified genes with either upstream or downstream shifts of the +1 nucleosome during any of the meiotic time points (Fig. 3A). Genes linked to the downstream-shifted nucleosome tended to be induced upon carbon starvation (Fig. 3B; χ2 test P = 10−37). The TSS of these genes was embedded near the +1 nucleosome dyad in rich media, potentially making it more refractory to transcription initiation, whereas under carbon starvation the nucleosome moved to the canonical location, where the TSS resides on the upstream nucleosome edge. In contrast, genes in which the +1 nucleosome was shifted upstream tended to be carbon-starvation repressed. Consistent with this, the position of the TSS shifted from a canonical location to the nucleosome dyad.
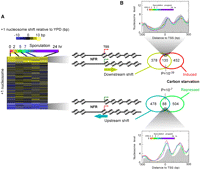
+1 nucleosome shift is linked with carbon starvation regulation. (A) +1 nucleosome midpoint distances from the position found in YPD were calculated for each gene (rows) at all time points (columns) and displayed as a cluster plot. Three distinct groups were identified by k-means clustering. Distances shifted downstream in a positive direction are color-coded yellow. Upstream shifts are colored blue. Equivalent shifts were evident across the genic nucleosomal arrays. (B) Venn diagram and χ-test are shown for the overlap of the indicated cluster of genes and those genes most up- or down-regulated (as indicated) upon carbon starvation (Bradley et al. 2009). Composite nucleosome distributions around the TSS are shown for the set of intersecting genes.
Transcription-linked histone modification marks exist at most genes and are selective for nucleosome positions
We next focused on transcription-linked acetylation and methylation states (Bernstein et al. 2002; Santos-Rosa et al. 2002; Ng et al. 2003; Kurdistani et al. 2004; Liu et al. 2005; Pokholok et al. 2005). Genome-wide fates of these modifications throughout a developmental program and its comprehensive localization to specific high-resolution nucleosome positions has not been previously determined. As expected, total chromosomal histone content increased and leveled off as cells progressed from stationary phase through DNA replication, meiosis, and onto spore formation (Supplemental Fig. S8A). Bulk histone modification densities (H3K9ac, H3K4me3, H3K36me3, and H3K79me3), which were normalized to bulk histone content, decreased over this time (Supplemental Fig. S8B–E). The rates of bulk loss of the methyl marks were consistent with a general loss of de novo methylation and a simple dilution of existing modification states as new unmodified histones are incorporated during DNA replication. Modification losses were not due to endopeptidase cleavage of the H3 amino-terminal tail (Santos-Rosa et al. 2009), as such cleavage was not detected (Supplemental Fig. S3).
We found H3K9ac predominantly at the +1 nucleosome (Fig. 4A, top row; Supplemental Fig. S4B; H3K9ac panel in Supplemental Figs. S6, S9), with a graded decrease into the body of the gene. Its predominance at +1 has not been previously reported. As expected, more frequently transcribed genes had higher H3K9ac densities (defined as position-specific H3K9ac/H3 ratios) at the +1 position. However, the differential was rather small (Supplemental Fig. S10, H3K9ac vs. H3 panel), which was not due to high background in the ChIP assay or due to high levels of nonspecific acetylation, because even lowly transcribed genes had high levels of acetylation enriched specifically at +1. Approximately 77% of all genes were enriched with H3K9ac at the +1 nucleosome compared with 36% expected by chance (Supplemental Fig. S11A).
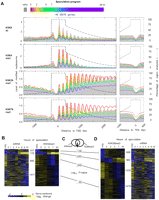
Nucleosomal and histone modification distribution around genomic features. (A) Distributions of indicated H3 modification states (rows of panels) are plotted around the TSS and TES for all genes. Traces reflecting different time points in the sporulation program are color-coded as indicated, and further described in Figure 1A. Total tag counts in each sample were scaled to reflect the bulk distribution, measured by immunoblotting (Supplemental Fig. S8). Consequently, the plots reflect the level of modified nucleosomes, not the density of modification per H3 nucleosome. The H3K79me3 antibody may have significant cross-reactivity with me2. Cluster plots for H3K4me3 (B) and H3K36me3 (D) changes on a gene-by-gene basis show that both H3K4me3 and H3K36me3 are linked with transcription. In contrast to A, the total tag count for all samples (H3, H3K4me3, and H3K36me3) were normalized to be equal. Each row included gene-centered log2 transformed H3K4me3/H3 ratios (from the 0- to 500-bp region relative to TSS for H3K4me3 and the 300- to 1000-bp region relative to TSS for H3K36me3) for all six time points. Gene-centering means that the average of each row is set to zero. All genes were arranged by k-means clustering (k = 5). The number of genes in each cluster is indicated. One cluster was omitted as it displayed no changes. Corresponding changes in mRNA levels (Primig et al. 2000; Williams et al. 2002) are shown. Levels of mRNA were gene centered and log2 transformed. (C) χ-tests between clusters of H3K4me3 and H3K36me3 suggest that two methylation marks are significantly coincident. Venn diagram relating the overlap of clusters 1–4 in B with the corresponding clusters in D. Values below the Venn diagram reflect log10 P-values (χ-test) of the overlapping membership.
Nucleosomes at positions +1, +2, and +3 appeared to be the primary sites of H3K4 trimethylation (Fig. 4A; H3K4me3 row of graphs in Supplemental Figs. S6, S9), in accord with other studies (Liu et al. 2005; Barski et al. 2007). Unlike acetylation, the H3K4me3 levels at these positions were not diminished at the start of meiosis (red trace compared with gray fill) (Fig. 4A, H3K4me3 row), but like acetylation, the mark receded uniformly at each position and globally at each gene as the sporulation program unfolded (Supplemental Fig. S4C).
Higher H3K4me3 densities were linked to higher transcription frequencies in YPD and gene induction during meiosis (Fig 4B; Supplemental Fig. S10, H3K4me3 vs. H3 panel), in accord with other studies (Liu et al. 2005; Barski et al. 2007). Remarkably, 74% of all genes had higher H3K4me3 density at nucleosomes +1,2,3 relative to nucleosomes in the middle of the same genes (Supplemental Figs. S4C, S11B). Thus, in contrast to the general view that H3K4me3 may be restricted to highly transcribed genes (Santos-Rosa et al. 2002; Ng et al. 2003; Liu et al. 2005; Shilatifard 2008), it instead appears to mark most genes.
When the H3K4me3-enriched genes were examined for gene-expression dependency on this mark, they displayed lower relative expression levels in set1Δ or H3K4A mutants, compared with those genes that normally lack H3K4me3 (using expression data from Venkatasubrahmanyam et al. 2007) (Supplemental Fig. S13). Set1 is the H3K4 methyltransferase. This suggests that the H3K4me3 cotranscriptional mark may function positively at most genes if we assume that those genes that lack the mark are not regulated by the mark.
The H3K36me3 mark is cotranscriptionally placed in the body of the gene (Krogan et al. 2003). As with H3K4me3, the H3K36me3 pattern was enriched at most genes (Supplemental Fig. S4D), with substantially greater levels at highly expressed genes (Supplemental Fig. S10, H3K36me3 panel). Normalized changes in H3K36me3 were also linked to meiotic gene expression (Fig. 4D). As expected of two cotranscriptional marks, changes in H3K4 and H3K36 trimethylation were highly coincident (Fig. 4C). The H3K36me3 mark was depleted at the +1 and +2 positions, but hyperenriched at the +3 to +6 position in stationary phase and up to 2 h into meiosis, which is just prior to DNA replication (Fig. 4A; Supplemental Fig. S9, H3K36me3 row).
The transcription-linked H2BK123Ub mark is needed to generate H3K79 methylation (Shilatifard 2006). We found that H3K79me2,3 was essentially enriched at all genic canonical nucleosome positions in roughly equal levels (Fig. 4A; Supplemental Fig. S4E; H3K79me3 panel in Supplemental Figs. S9, S10), and generally was not correlated with expression levels in rich media or during meiosis. As sporulation progressed, each nucleosome position lost the H3K79me3 mark monotonically, as with the other methyl marks and in accord with dilution by genome replication.
Histone marks around recombinational hotspots and promoters are similar
We also examined the distribution of histone marks around genome-wide locations of DSB recombination hotspots and coldspots (Fig. 5), and found patterns that were consistent with what was observed at promoter regions. Indeed, DSB hotspots were enriched in promoter (and termination) regions (Supplemental Fig. S14), which is consistent with previous suggestions of enrichment in intergenic regions or at a few selected promoters (Wu and Lichten 1994; Gerton et al. 2000; Cromie et al. 2007), but has not before been attributed to promoter NFRs.
Distribution of nucleosomes and histone modification states around meiotic recombination hot and cold spots. The distribution of nucleosomal tags and levels of the indicated modification states around double-strand break (DSB) hotspots and cold spots (Borde et al. 2009) during the sporulation program are displayed in the first two columns of graphs. To assess nucleosome densities, plots should be compared against Figure 2A. The third column displays tag distributions around the TSS as shown in Supplemental Figure S9B for comparison, but is highly smoothed to achieve the lower resolution of the DSB sites.
H3K9ac was concentrated closest to hotspots, followed nearby by H3K4me3. H3K36me3 and H3K79me2,3 were depleted near the hotspots and enriched at more distal regions, including at recombinational coldspots. As previously shown with H3K4me3 (Borde et al. 2009), histone marks pre-existed around DSB hotspots well before meiotic DSBs are generated and exist well after they are resolved. Thus, the chromatin surrounding DSBs have a clear organization of histone marks, and these marks appear to be a rather stable feature of the genome that demarcate where DSBs are to occur.
Antisense repression of meiotic genes
Antisense transcription is emerging as an important means by which sense transcription is repressed (Camblong et al. 2007; Granovskaia et al. 2010). For instance, IME4, a proposed master regulator of the entry into meiosis, is repressed in mitotically growing cells via antisense transcription (Hongay et al. 2006). However, it is unclear whether repression of gene expression by antisense transcription is a wide-spread form of regulation for large classes of coexpressed genes. We therefore examined the extent to which meiotically induced genes are repressed in mitotically growing cells by antisense transcription.
As an indicator of antisense transcription, we sought genes having more H3K4me3 in the 3′ versus 5′ region during mitotic growth. Approximately 10% of all genes (641) had higher 3′ H3K4 methylation (5′/3′ log2 ratio < 0). Analysis of existing transcriptome data confirms the presence of antisense transcription at these genes (Fig. 6).
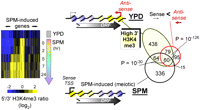
H3K4me3 provides a signature of repressive antisense transcription. The ratio of H3K4me3 density at the 5′ end to the 3′ end of every gene was calculated. The intersecting genes of meiotic specific genes and the genes having log2 ratios that were negative at rich media were selected and k-means (k = 3) clustered (n = 124). The cluster plot is shown on the left and is turned 90° from the normal orientation. Genes are columns, rows are time points, and blue/black/yellow color scale reflects the log2 5′/3′ ratio. The top Venn diagram shows the overlap between these genes and those that produce greater antisense than sense transcription (Parkhomchuk et al. 2009). The bottom Venn diagram shows the overlap with sporulation-induced genes (Chu et al. 1998). χ-test P-values are shown.
When a set of 575 meiotically expressed genes were examined, more than 20% had greater 3′ H3K4me3 (lower left Venn diagram, P = 10−30), with more than half of these having more antisense transcripts than sense transcripts in YPD identified in one RNA-seq study (Fig. 6, Venn diagram). During the course of meiosis nearly all of these genes transitioned from having an enrichment of H3K4 methylation at the 3′ end to having K4 methylation enrichment at the 5′ end (Fig. 6, cluster plot). Thus, we conclude that a large fraction of the yeast meiotic program is repressed by antisense transcription taking place during mitotic growth.
Discussion
Chromatin organization is a constant, but with locus-specific plasticity
The constancy of the overall primary structure of chromatin as it proceeds through a full gamut of transactions that any chromosome would be expected to experience during its lifetime, including DNA replication, recombination, transcription, chromosome segregation, and compaction, is remarkable in that many of these transactions would be expected to alter chromatin structure. These in vivo findings contrast with one expectation from in vitro experiments that a ∼165-bp nucleosome repeat length must increase by ∼30 bp in order to undergo compaction (Routh et al. 2008). Indeed, simple a priori expectations are that NFRs would acquire nucleosomes during compaction and become more closely spaced; nucleosomes that are not well positioned might have become more organized, but these outcomes were not observed.
The concept that these findings demonstrate is that during any transaction including compaction and packaging, the genome maintains its accessibility to cellular factors. In particular, an accessible state readies the cell for gene expression upon spore germination. Should NFRs be filled in and linkers collapse, then the germinating spore would need to have evolved mechanisms that reestablish the functional state of chromatin. Particularly challenging would be specifying the removal of nucleosomes that occupy NFRs, and in having chromatin remodeling complexes gaining access to linker regions to reestablish proper spacing. Consistent with the importance of maintaining chromatin structure, histones are retained at developmentally important genes in mammalian gametogenesis, whereas protamines replace histones at most other locations (Hammoud et al. 2009). Thus, in yeast, higher-order chromosome compaction appears to occur without perturbation to the primary physical state of chromatin, indicating that normal chromatin structure is compatible with a series of yeast meiotic chromosomal events, including compaction. Such maintenance of primary chromatin may be applicable to the condensed chromatin states occurring in multicellular eukaryotes.
Specific locations related to gene expression do undergo local reorganization, including decreased nucleosome occupancy levels in association with the passage of RNA polymerase during transcription and +1 nucleosome repositioning, which may regulate TSS access as seen during the cell cycle (Kelly et al. 2010). Occupancy of the NFR by nucleosomes may not appear to be a general mechanism to repress gene expression, but instead may be a mechanism that is restricted to certain types of genes. For example, TATA-containing genes, which constitute a small fraction of the genome, tend to have nucleosomes that encroach on the NFR, and thus may be repressed by such a mechanism. In contrast, nucleosome occupancy changes do occur within transcribed regions, which is evident at high levels of transcription; this may be related to transient displacement by the elongating transcription machinery.
The concept that nucleosome occupancy of NFRs does not represent a widespread mechanism of repression is also applicable to RNA polymerase III transcription units and recombinational hotspots in general, wherein these regions remain constitutively nucleosome free. Thus, factor recruitment rather than steric exclusion may be a key regulatory step that is common among these processes.
Regulation of transcription initiation by +1 nucleosome repositioning vs. antisense
In Saccharomyces the position of the +1 nucleosome has largely been thought of as being fixed at a canonical distance from the TSS, which places the TSS on the edge of the nucleosome. This presumably is a suitable spot for transcription initiation for reasons that remain to be worked out. While a positionally displaced nucleosome could occur either further upstream or downstream from its canonical location, we observed only placement where the TSS was buried near the nucleosome dyad, under conditions where the gene is repressed. This represents a clear example in which nucleosome repositioning acts concertedly on a group of coexpressed and reciprocally expressed genes (carbon-response genes), possibly revealing a general mechanism for transcriptional regulation that may also be applicable to other classes of genes.
Conceivably, under energy-rich growth conditions, nucleosomes may be actively placed in thermodynamically less favorable positions at carbon-responsive genes, a concept whose mechanism has been developed elsewhere (Whitehouse et al. 2007). Under comparatively lower energy states in carbon-depleted media, this energy-consuming organization would not be maintained, thereby allowing those nucleosomes to move toward DNA-encoded positions (Supplemental Fig. S7). For carbon-utilization genes, the DNA-encoded positions correspond to the active state. For genes that are down-regulated in carbon-depleted media, the DNA-encoded positions correspond to the repressed state.
In contrast to the carbon starvation stress response, a similar nucleosomal shift was not evident at meiotically regulated genes at any time during meiosis. The temporal activation of meiotically regulated genes represents a timed developmental program, whereas response to carbon starvation may represent more of an acute stress response. We speculate that nucleosome positioning control of the TSS may reflect a particular regulatory theme for acute/immediate transcriptional responses, whereas a program consisting of a series of responses may involve alternative types of regulation. Our analysis suggests that the latter could include negative regulation through antisense transcription, which is evident by a reversal of the 5′–3′ gradient of transcription-linked histone marks. As long-lived marks of transcription, such inverse gradients may be useful in identifying antisense transcription having unstable transcripts.
A large fraction of meiotically expressed genes are repressed in rich media, and this repression is associated with antisense transcription. Antisense transcription has been demonstrated to play gene-specific roles in repression (Hongay et al. 2006), but has not before been demonstrated to be broadly associated with a large set of coregulated genes. Studies suggest that there may be multiple mechanistic roles of antisense transcription in sense inhibition. The extent to which antisense contributes to repression of meiotic genes and whether the same mechanism is involved at all of these genes, remains to be determined. We suspect that the purpose of antisense transcription at meiotic genes provides an added level of repression that already exists at the promoters of these genes. This redundancy may ensure that little or no basal meiotic gene expression occurs in rich media, which otherwise might be detrimental to the cell.
Transcription-linked nucleosome modification states mark nucleosome positions at most genes
The study presented here provides a comprehensive high-resolution genome-wide map of histone modification states that occur along a developmental pathway and expands upon earlier lower resolution and lower coverage modification state maps in YPD (Liu et al. 2005; Pokholok et al. 2005). The concentration of H3K9ac at the +1 nucleosome, H3K4me3 at +1,2,3, H3K36me3 at all genic positions except +1,2, and H3K79me3 at all genic locations, results in a specific marking system in which the first four nucleosomes downstream of the TSS may be distinguished from each other. This may be important for events surrounding transcription initiation and early elongation, where nucleosome-binding regulatory proteins selectively interact with nucleosomes in a position-specific manner (Koerber et al. 2009). However, there is no evidence that the widespread occurrence of marks as detected here is linked to an equivalent widespread binding of cognate factors, and so additional regulatory determinants are likely involved.
Most genes contain position-specific transcription-linked histone marks, but paradoxically, most genes are infrequently transcribed (i.e., at a basal level). On the time frame of each transcription cycle, these marks may be quite long-lived. Thus, the marks may be constitutively present to a large extent, and any that are lost over time might be regenerated with each transcription event. In stationary phase and throughout the stages of sporulation, these marks dissipate (acetylation more rapidly than methylation), possibly owing to a substantial drop in basal transcription. The persistence of these marks, particularly at +1, presents a conundrum in that the +1 nucleosome is relatively dynamic (Dion et al. 2007; Rufiange et al. 2007). Conceivably, the same modified histone may be preferentially returned to the same site once it is evicted, perhaps owing to a negligible local pool of free histones, or some mechanism must exist to restore pre-existing modification states.
Methods
Cell harvest
All results were obtained from the DSY1089 diploid strain (Raithatha and Stuart 2005), which is an SK1 background. The sporulation protocol is as described (Primig et al. 2000). All growth and sporulation procedures were carried out at 30°C. Colonies from YPG plates were incubated in 5 mL of YPA media overnight, then inoculated into 500 mL of YPA at 275 rpm, using one flask per time point. Cells were grown to a density of 8.0 x 10⁷ cells/mL (∼OD 1.9), then 450 mL were harvested by centrifugation, washed with distilled water, and stored at 4°C overnight. Cells were then resuspended in prewarmed 450 mL of SPM media and incubated at 30°C at 275 rpm for 0, 2, 5, 7, 9, 11, and 24 h, then fixed with 1% formaldehyde for 15 min, and quenched with 0.125 M glycine for 5 min. Samples were taken to perform DAPI staining and flow cytometry at the same time as harvesting. The cells grown to log phase (OD = 0.8–1.0) in YPD were processed similarly. Each nucleosome map was produced by averaging two independent biological replicates. Maps derived from each sample were indistinguishable from their biological replicate.
Monitoring of sporulation progression
The sporulation efficiency was evaluated by FACS and DAPI staining. The cells for FACS analysis were fixed with 70% ethanol and stained with Propidium iodide at the Flow Cytometry Facility at Penn State University. The cells for DAPI staining were also fixed with 70% ethanol, resuspended in TE, and sonicated for 30 sec. A total of 5 uL of DAPI was added to the sample and cells counted at 100× zoom under a microscope.
Evaluation of mononucleosome extraction
Since the cell walls of mature spores (24-h samples) resist disruption, we added an additional sonication step before cell lysis. After chromatin preparation, the pellet was checked under the light microscope, no intact spores were observed.
NUC1 is a mitochondrial endonuclease that is released upon cellular disruption. Studies on DSB break repair and meiotic chromatin commonly use a nuc1 mutant so as to eliminate nonspecific chromosomal cleavage (de Massy et al. 1995; Buttner et al. 2007). However, the formaldehyde cross-linking that we use in vivo typically inactivate proteins including NUC1. Consistent with this, chromatin pellets prior to MNase digestion revealed no degradation of the chromatin (Supplemental Fig. 2B), which would need to occur if NUC1 activity were creating the observed chromatin patterns.
Preparation of sequencing samples
Cells were collected and disrupted by bead beating. Chromatin was prepared and washed with FA lysis buffer (as described in Albert et al. 2007). Mononucleosomes were solubilized with 40 U of MNase in 600 uL of NP-S buffer (0.5 mM Spermidine, 0.075% IGEPAL, 50 mM NaCl, 10 mM Tris-Cl [pH 7.5], 5 mM MgCl2, 1 mM CaCl2, 1 mM β-mercaptoethanol). The mononucleosomes were incubated with primary antibody overnight at 4°C, then immunoprecipitated with Protein A Sepharose for 1.5 h. Stringent washes were applied to minimize nonspecific binding (Albert et al. 2007). Samples were then prepared for DNA sequencing using Applied Biosystems SOLiD genome sequencer.
Antibodies
The following antibodies were obtained from Abcam (cat. No.): H3 (ab1791), H3K4me3 (ab8580), H3K79me3 (ab2621, may have some cross reactivity with K79me2), H3K36me3 (ab9050), beta-actin (ab8224), H3K9ac (Millipore 07-352). Since H3K79me3 pattern looked like H3, we confirmed its specificity by Western blotting with a H3K79A mutant.
Immunoblot normalization
The cells used for immunoblotting were harvested and processed as described above, only without the formaldehyde cross-linking. This includes chromatin pellet washes to remove unbound histones, and thus produces a measure of bulk chromosomal histone levels. The same OD equivalents of cells were loaded on an SDS–polyacrylamide gel to measure the relative bulk H3 level ratio between time points. To calculate the modified histone density ratio between different time-point samples, the modified histones were normalized to the bulk H3 histone level. Actin was used as a loading control. The band intensity was quantified using ImageJ software. At least six replicates were included in the ratio calculation.
Data analysis
Sequencing tags were aligned to the genome using the SHRiMP software package (Rumble et al. 2009). The coordinate of the 5′ end of each sequencing tag was shifted 73 bp toward the 3′ direction to reflect the location of the nucleosome midpoint (dyad). Tag counts located between ±4 kb of 6576 annotated TSSs were collected in 1-bp bins. The TSS/TES annotation was compiled from existing TSS/TES resources (David et al. 2006; Miura et al. 2006; Nagalakshmi et al. 2008; Xu et al. 2009). Each H3 data set was scaled to set total counts to be equal. Similarly, for histone modification states each data set was scaled such that the total tag counts reflected bulk modification densities, as shown in Supplemental Fig. S8. These binned distributions of modification states do not take into account local changes in nucleosome occupancy levels.
Nucleosome calls were made by GeneTrack software (Albert et al. 2008). The fuzziness and width calculations are described elsewhere (Mavrich et al. 2008). Processed nucleosome data including nucleosome midpoints, tag counts and fuzziness are available as Supplemental Table S2.
The DSB hotspot coordinates were obtained from published studies (Borde et al. 2009), the 1013 sites with the lowest DSB ratio were selected as the coldspot sites.
To calculate, histone modification 5′/3′ ratios, each ORF was divided into equal length 5′ and 3′ ends. The H3 and H3 modification tags mapped to the 5′ and 3′ ends for each gene were counted; the ratio of 5′/3′ was calculated to be the following: (5′ histone modification tags/5′ H3 tags)/(3′ histone modification tags/3′ H3 tags).
Acknowledgments
We are very grateful to Zhenhai Zhang for providing a computational pipeline to conduct data analysis. We thank the members of the Pugh and Ma labs for advice and support. SOLiD sequencing was performed at the Penn State Genomics Core Facility. This work was supported by NIH grant HG004160 to B.F.P.
Footnotes
-
↵4 Corresponding authors.
E-mail bfp2{at}psu.edu; fax (814) 863-8252.
E-mail hxm16{at}psu.edu.
-
[Supplemental material is available for this article. The sequencing data from this study have been submitted to the NCBI Sequence Read Archive (http://www.ncbi.nlm.nih.gov/Traces/sra/sra.cgi) under accession no. SRA012303.]
-
Article published online before print. Article, supplemental material, and publication date are at http://www.genome.org/cgi/doi/10.1101/gr.117465.110.
- Received November 4, 2010.
- Accepted March 1, 2011.
- Copyright © 2011 by Cold Spring Harbor Laboratory Press


