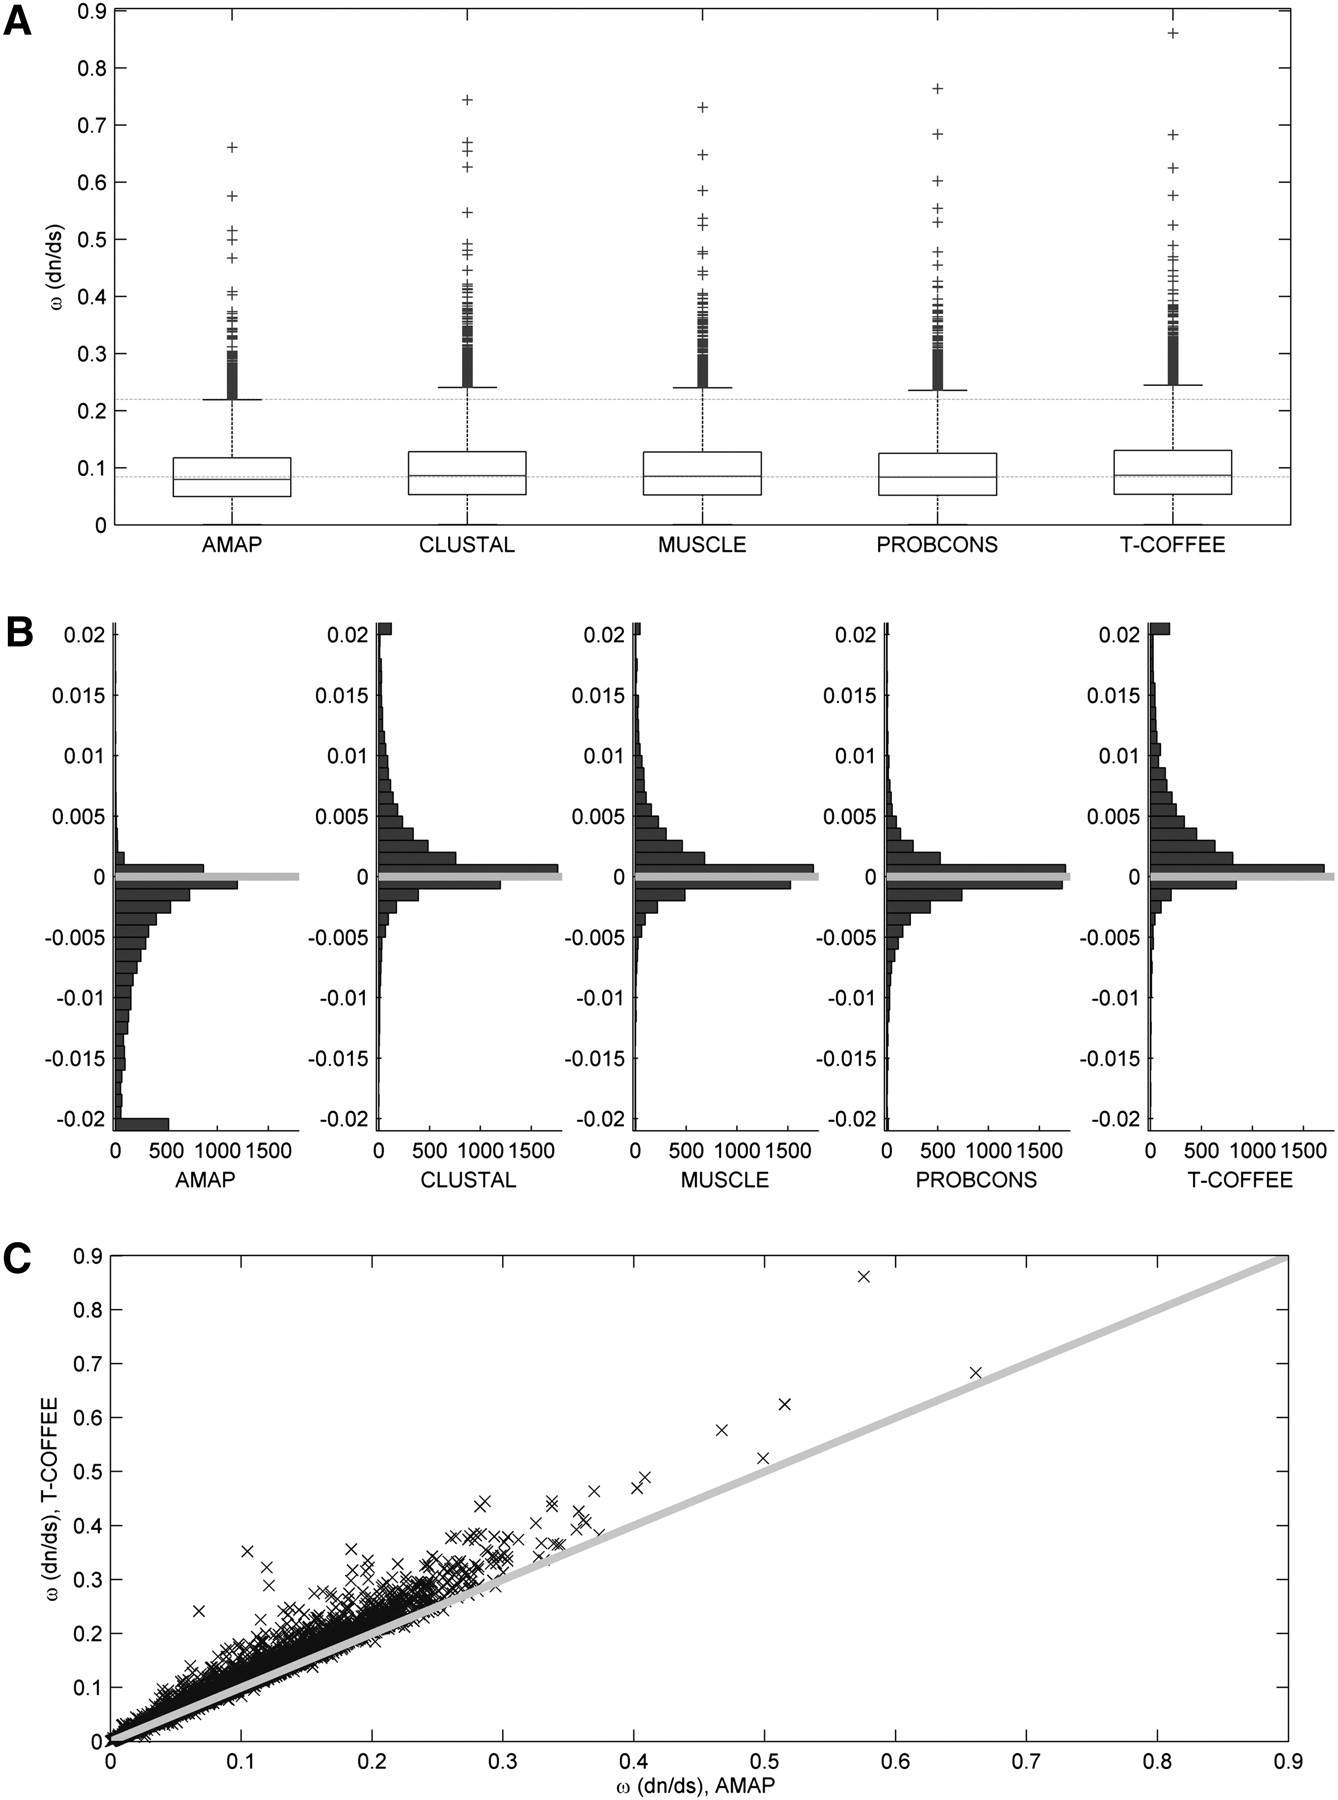
High sensitivity to aligner and high rate of false positives in the estimates of positive selection in the 12 Drosophila genomes

(Downloading may take up to 30 seconds. If the slide opens in your browser, select File -> Save As to save it.)

Click on image to view larger version.

Figure 1.
Figure 1.

Impact of aligner choice on the estimated rates of protein evolution. (A) Box plot of ω, or dn/ds,Ka/Ks, values per gene depending on the aligner used. (B) Frequency distribution of the difference per gene between ω based on a given aligner and the average ω among all five aligners. (C) ω of AMAP vs. T-Coffee.

This Article

  1. Genome Res. 21: 863-874

Preprint Server