
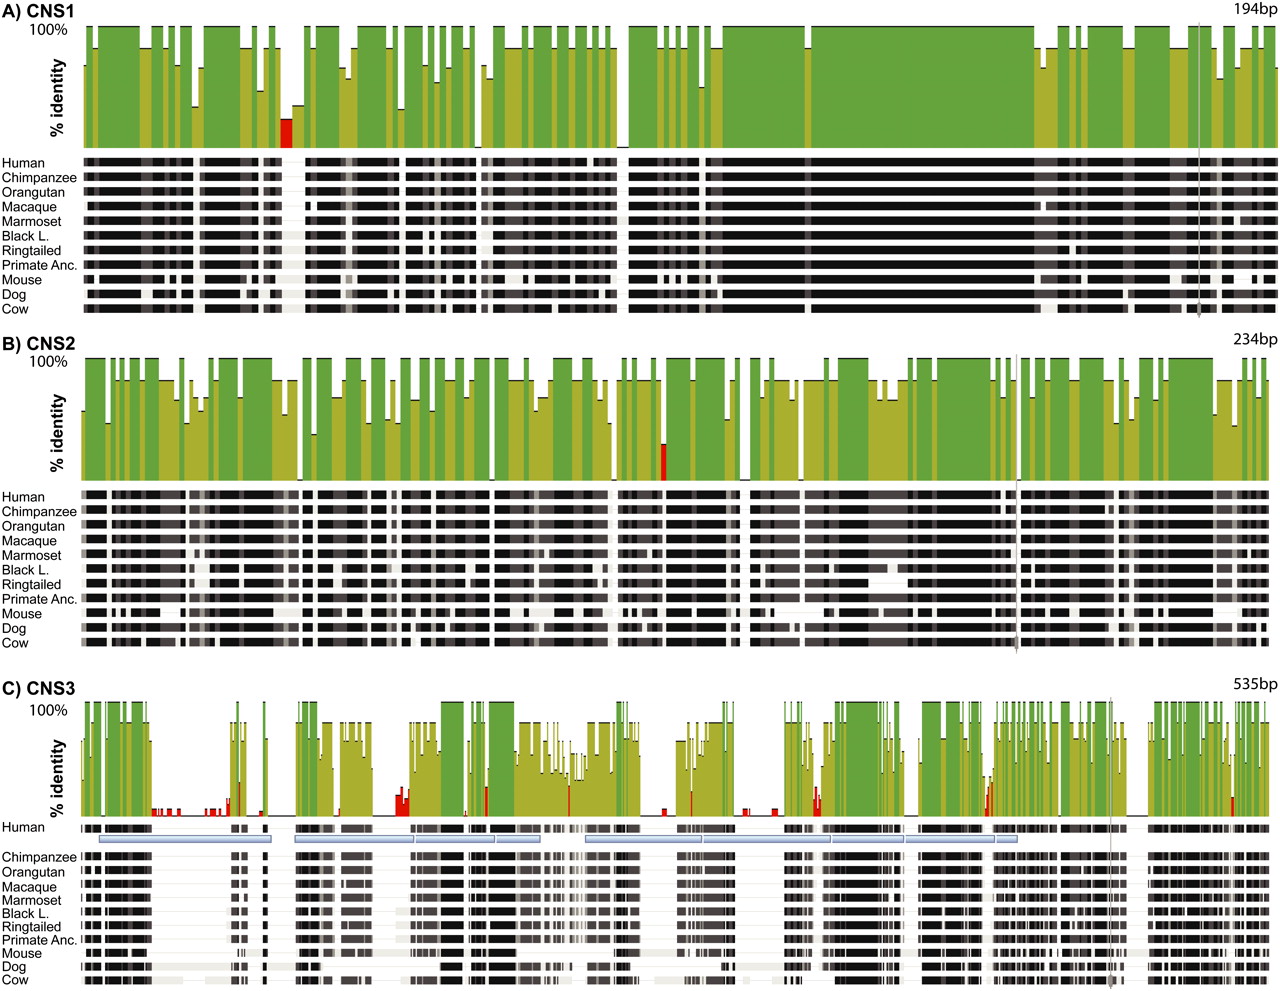
Multispecies alignments of conserved noncoding regions. Schematics of alignments across conserved noncoding sequences (CNS) are shown. See Figure 5 for the approximate locations within XIST. Along the top of each alignment is the sequence identity plot (from zero to 100% identity) comparing these sequences across all species and the reconstructed primate ancestor. (Green peaks) 100% identity among all species; (yellow and red peaks) lower identities. (A) CNS1 spans 194 bp and covers most of XIST/Xist exon 4. (B) CNS2 spans 243 bp. (C) CNS3 spans 535 bp and covers the XIST/Xist A repeat. (Light blue bars below the human sequence) The human A-repeat monomer units.


