
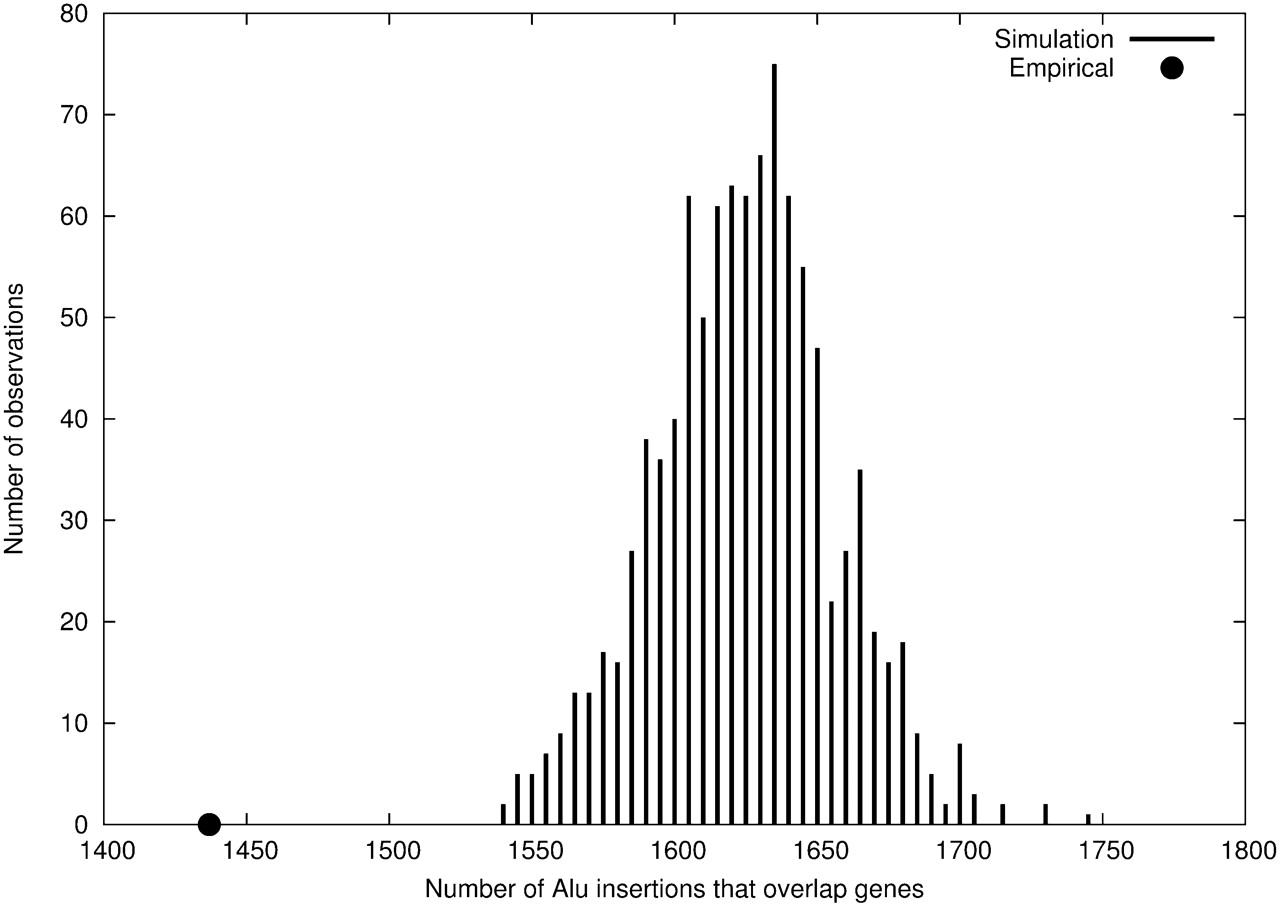
Figure 3.
Gene overlap analysis. 1437/4342 (33.1%) of predicted Alu insertions map within a human gene as defined by RefSeq (black dot). The histogram shows the expected distribution of gene overlap based on 1000 permutations.
(Downloading may take up to 30 seconds. If the slide opens in your browser, select File -> Save As to save it.)
Click on image to view larger version.
Gene overlap analysis. 1437/4342 (33.1%) of predicted Alu insertions map within a human gene as defined by RefSeq (black dot). The histogram shows the expected distribution of gene overlap based on 1000 permutations.
 CiteULike
 Delicious
 Digg
Digg Facebook
 Google+
 Reddit
 Twitter
