
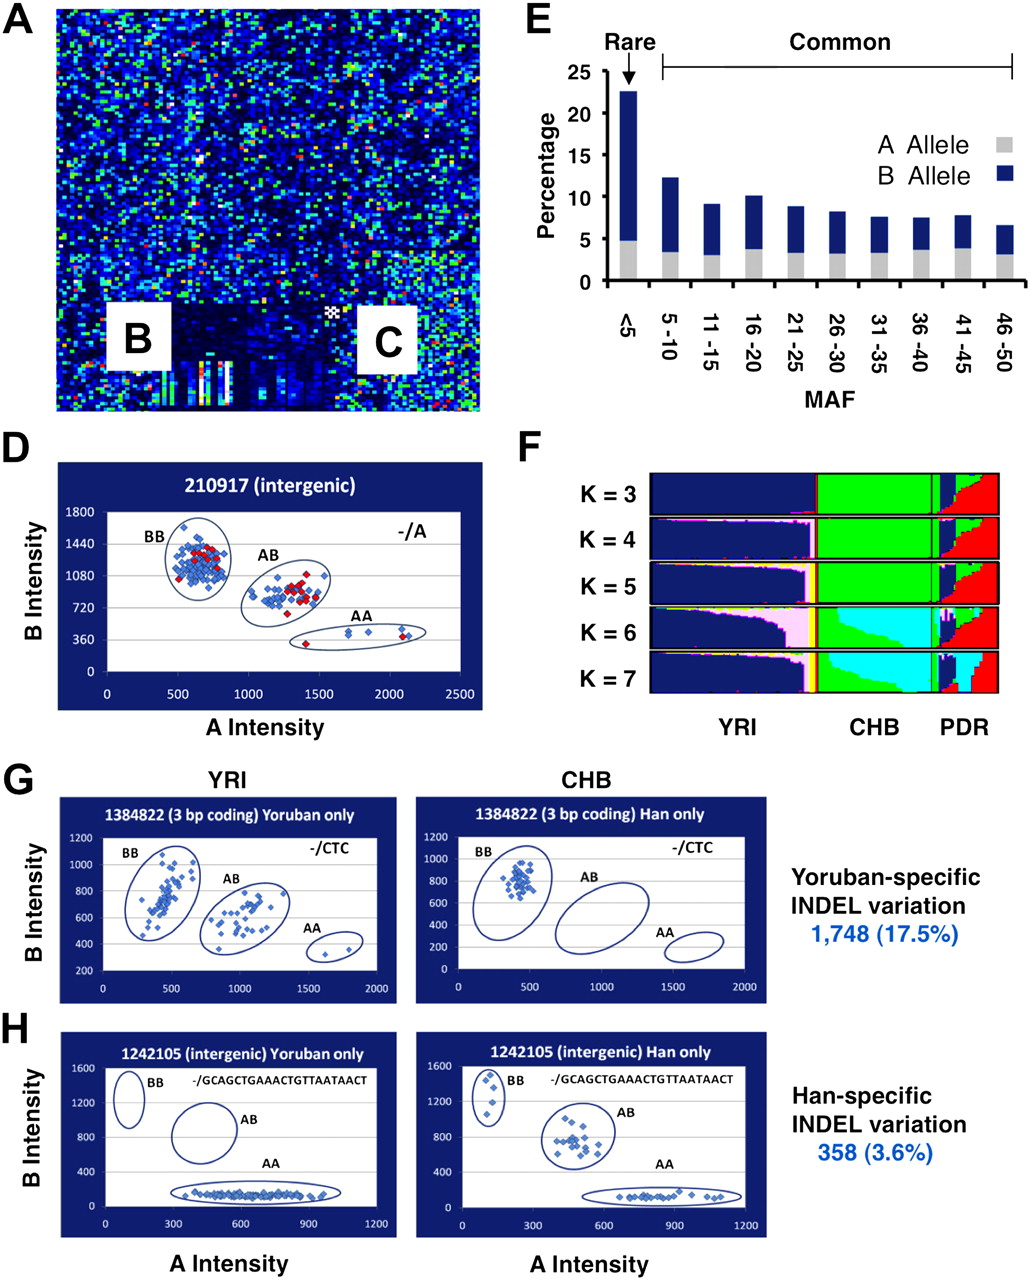
Affymetrix INDEL genotyping arrays. (A–C) A region of a custom Affymetrix INDEL microarray is shown following hybridization and scanning using protocols established for the Affymetrix 6.0 array. Section C contains 1500 Affymetrix SNPs that were developed for the HapMap project and are also present on the SNP 6.0 array. These were included as positive controls. The average cqc for our arrays after excluding arrays with scores below 0.4 was 2.2, with a range of 0.53–3.67. The call rate was 96.1%. Section B contains a manufacturing control. Section A represents the remainder of the array, which contains INDEL probes. (D) Plot of signal intensities for a typical set of INDEL probes following BRLLM-P analysis. Note that three distinct clusters were obtained for the three INDEL states (AA, AB, BB). PCR validation studies were conducted in parallel to evaluate the accuracy of the calls (Supplemental Table 9). A typical result is shown for INDEL 210917. The 24 individuals from the polymorphism discovery resource (PDR) (Collins et al. 1999) that were sampled by PCR are shown in red (the calls were 100% concordant between the arrays and the PCRs). The overall validation rate with 12 representative INDEL assays in 24 individuals was 99% (Supplemental Table 9). (E) Allelic frequencies. The allelic frequencies are plotted for the 10,003 INDELs that were examined on the INDEL microarrays (Supplemental Table 8). Although the majority of variation meets the definition of common genetic variation (where the minor allele has a frequency of ≥5%), rare INDELs also were identified. (F) Structure plot of INDEL data. The INDEL genotypes from our arrays were analyzed for population substructure. The PDR panel, which was designed to capture global diversity, has a large degree of substructure (as indicated by the colored peaks; right). The Yoruban (YRI) and CHB populations also have some residual substructure. (G) Population-specific INDEL variation. INDELs were identified where both INDEL alleles were present in one population but only one allele was present in the other. An example of a YRI-specific INDEL is shown. Note that both A and B alleles are present in the YRI population (and all three genotypes are present), whereas only the B allele (and one genotype) is present in the CHB population. The INDEL shown (1384822) is a 3-bp coding INDEL. (H) An example of a CHB-specific INDEL.


