
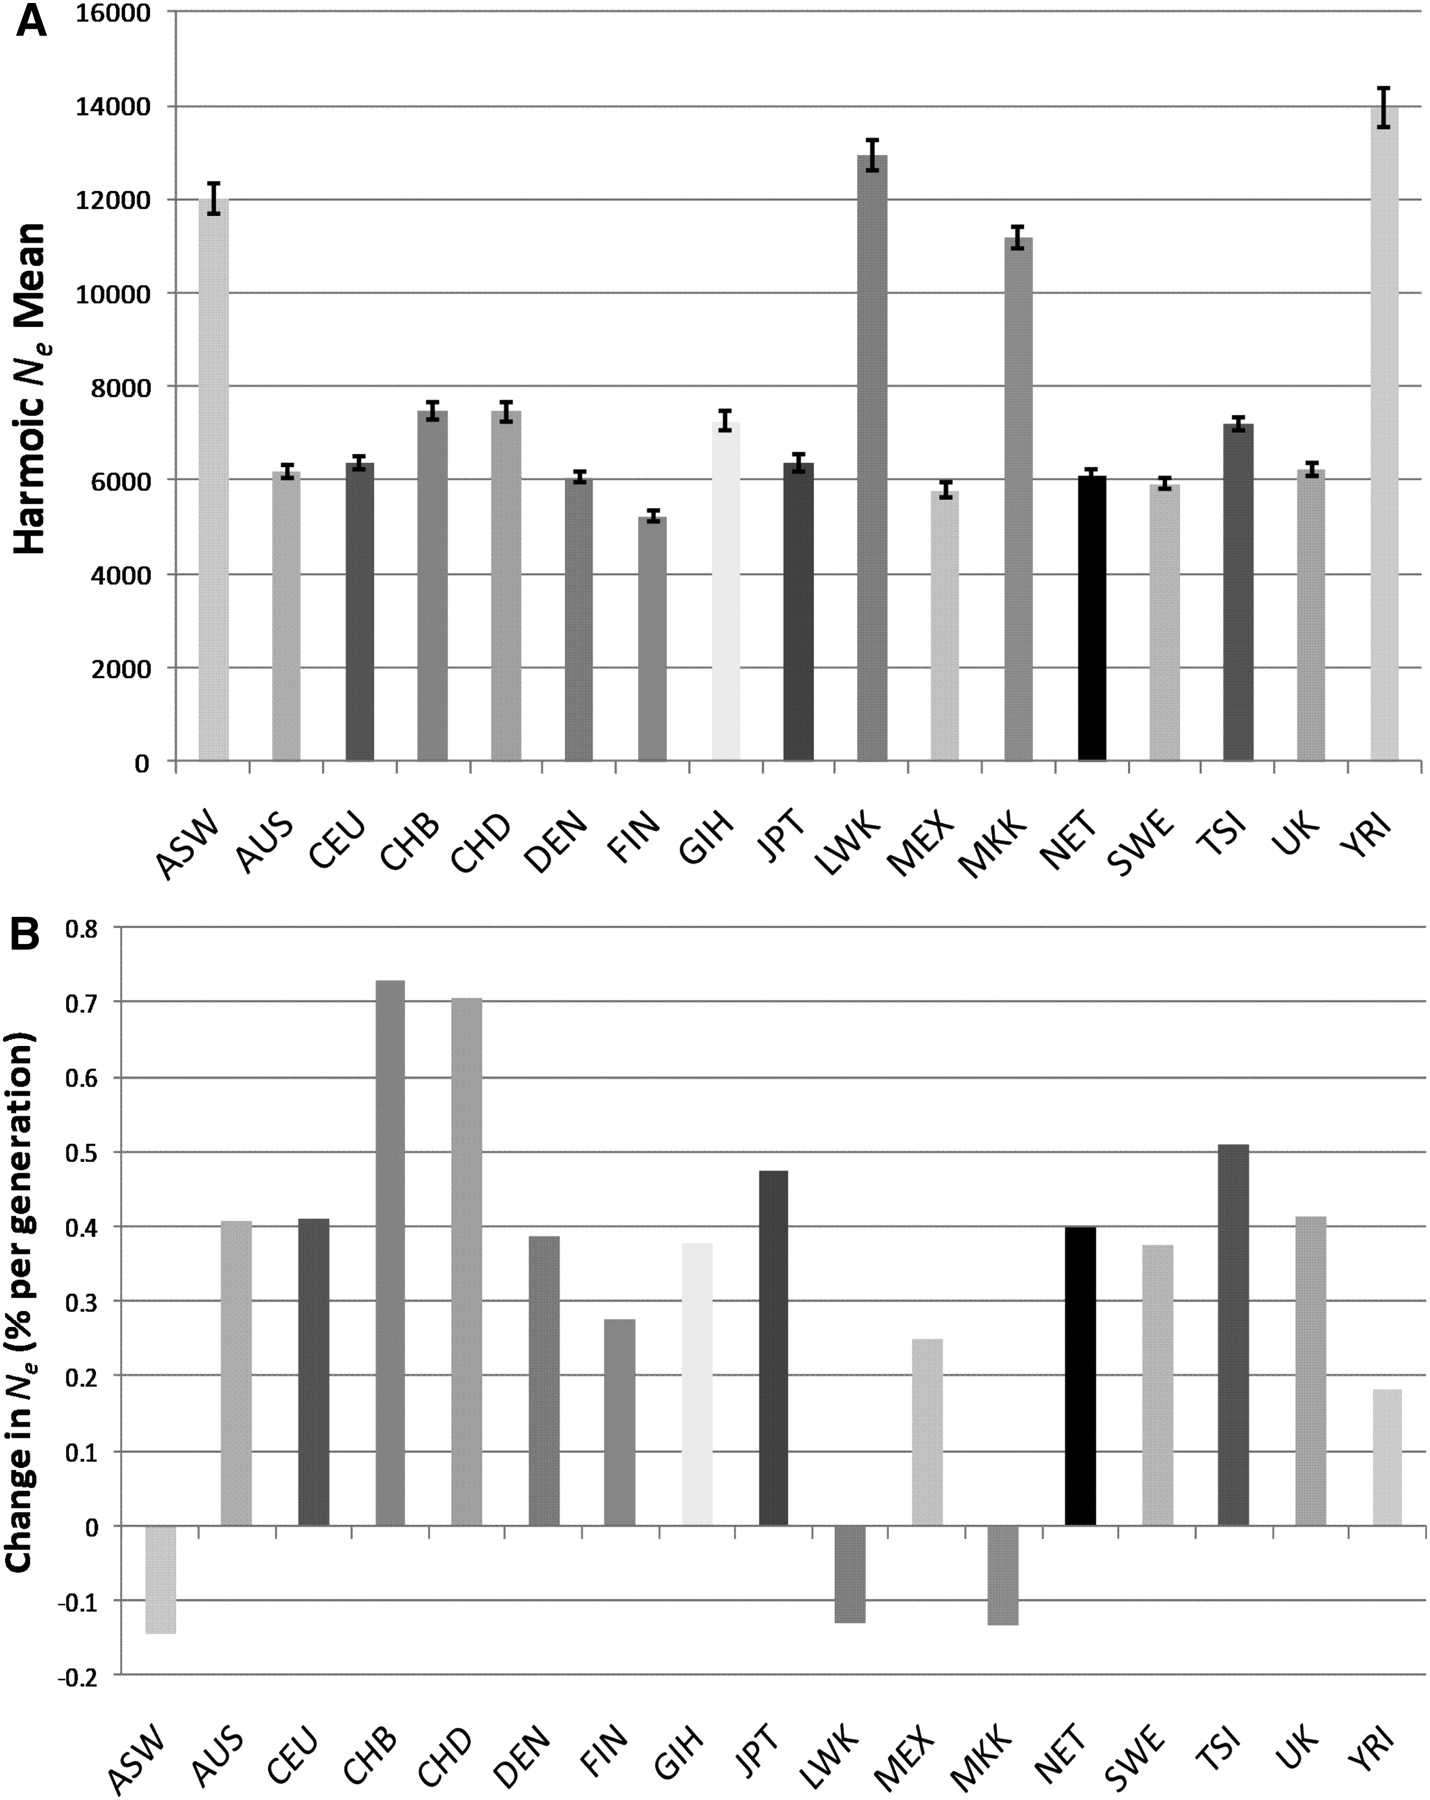
Figure 3.
(A) The harmonic mean of Ne for each population over all recombination distance classes up to 0.25 cM. The Ne illustrated is the average from separate analysis of each autosomal chromosome, which allows the placement of 95% confidence intervals on each estimate as indicated by the error bars. (B) Ne growth rate, calculated as the percentage change in Ne at t = 200 compared to t = 800 averaged over the 600 generations. See Figure 1 for population codes.


