
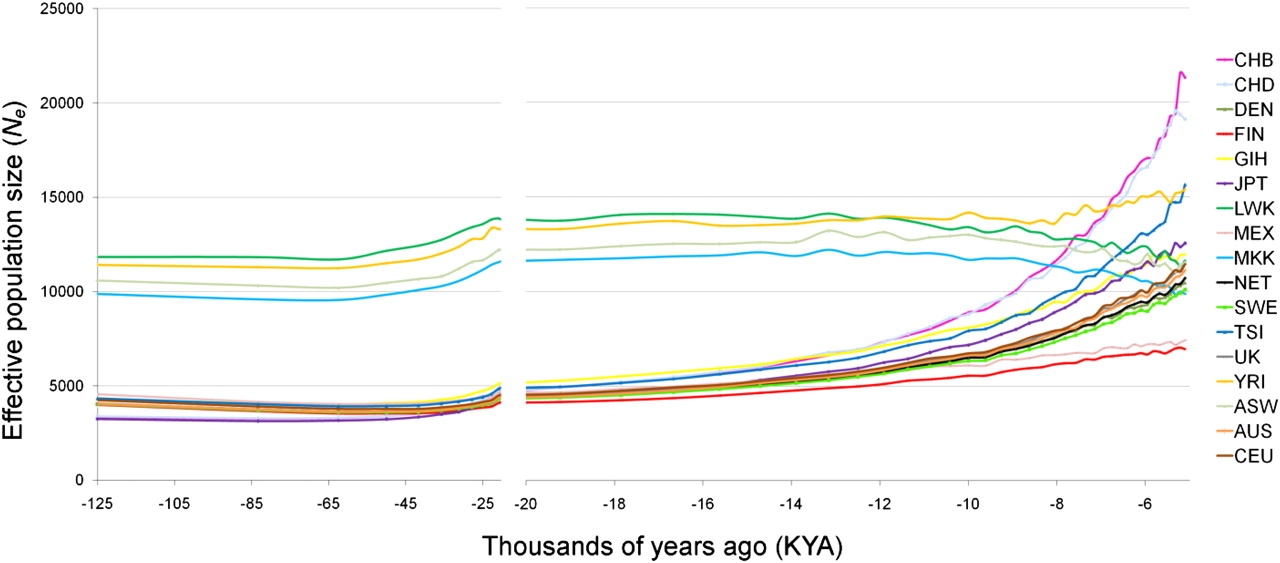
Figure 2.
Spatial and temporal variation in Ne estimates. Ne was calculated from LD observations in each of 50 recombination distance classes for each population. Note the change in the time axis scale at 20 KYA. The underlying LD structure upon which these Ne estimates are based can be seen in Supplemental Figure 5.


