
Figure 1.
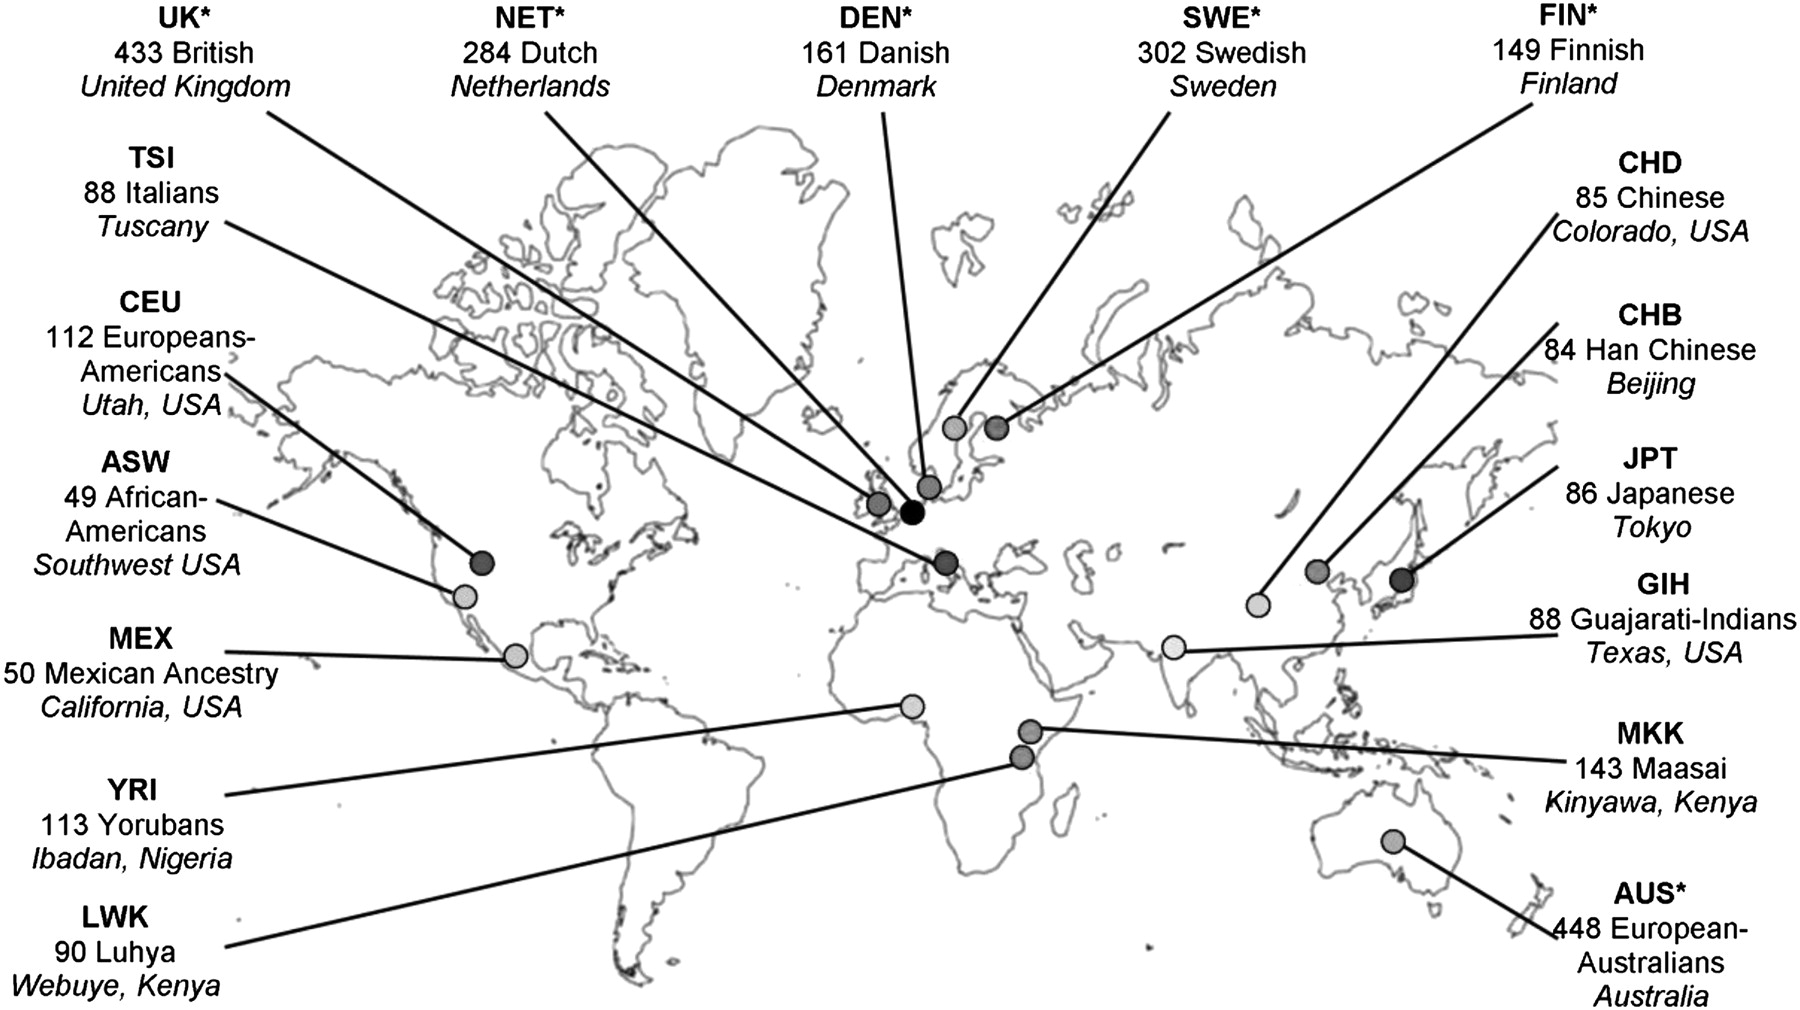
Populations, codes, and sample sizes. The sampling location is indicated in italics. GenomEUtwin populations are marked *; otherwise samples are from HapMap 3. See also Supplemental Table 1.
(Downloading may take up to 30 seconds. If the slide opens in your browser, select File -> Save As to save it.)
Click on image to view larger version.
Populations, codes, and sample sizes. The sampling location is indicated in italics. GenomEUtwin populations are marked *; otherwise samples are from HapMap 3. See also Supplemental Table 1.
 CiteULike
 Delicious
 Digg
Digg Facebook
 Google+
 Reddit
 Twitter
