
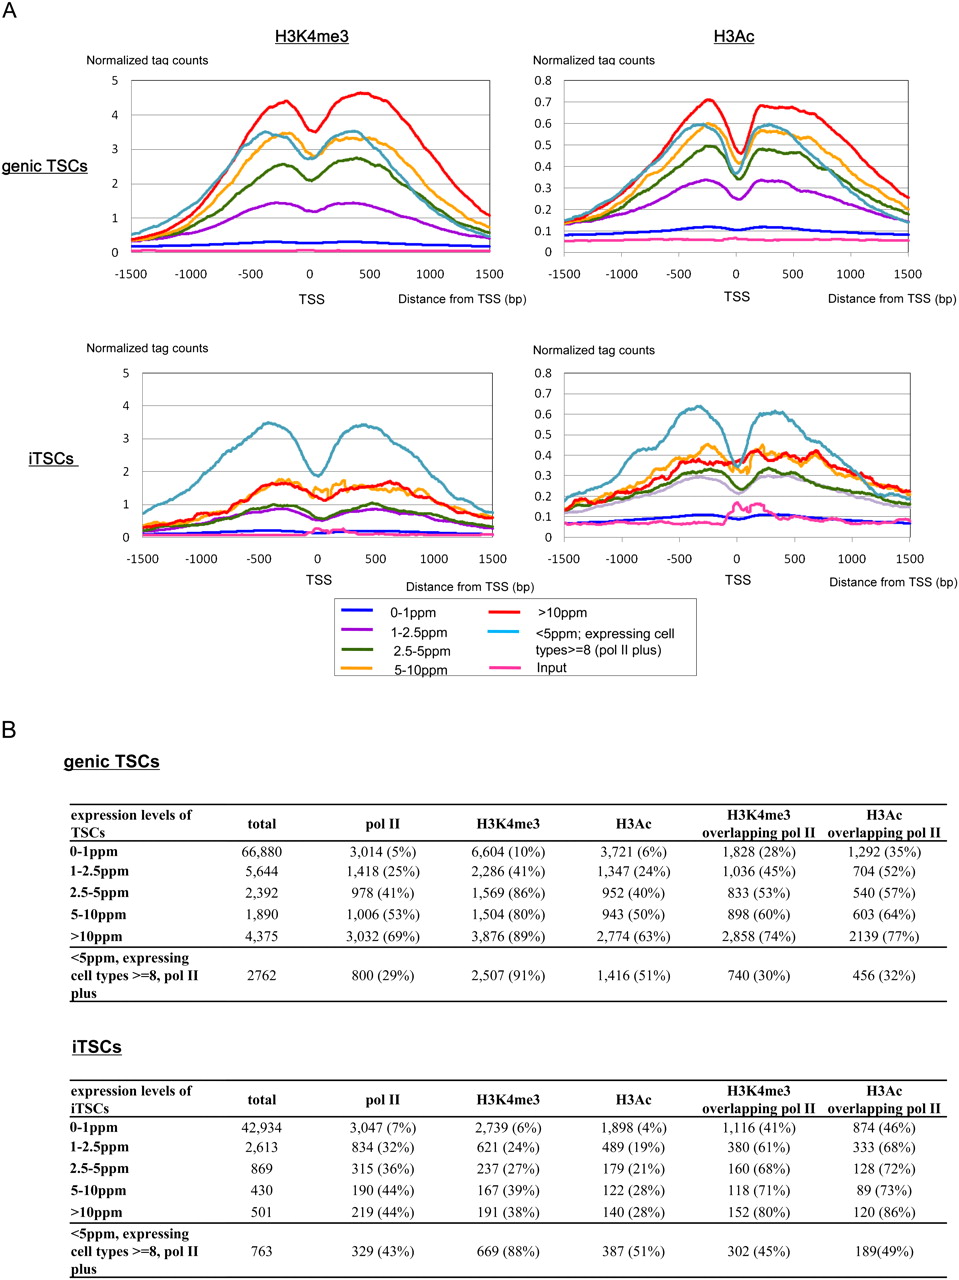
Figure 8.
Histone modifications in regions surrounding the TSCs. (A) Average tag concentrations (y-axis) obtained in ChIP-seq analyses of H3K4me3 (left) and H3Ac (right) in the surrounding regions of genic TSCs (top) and iTSCs (bottom) for DLD-1 cells. Expression levels of the TSCs are indicated in the insets. (B) Number of TSCs overlapping the indicated signals. For the extensive analysis using the nucleosome-seq data, see Supplemental Figure S9.


