
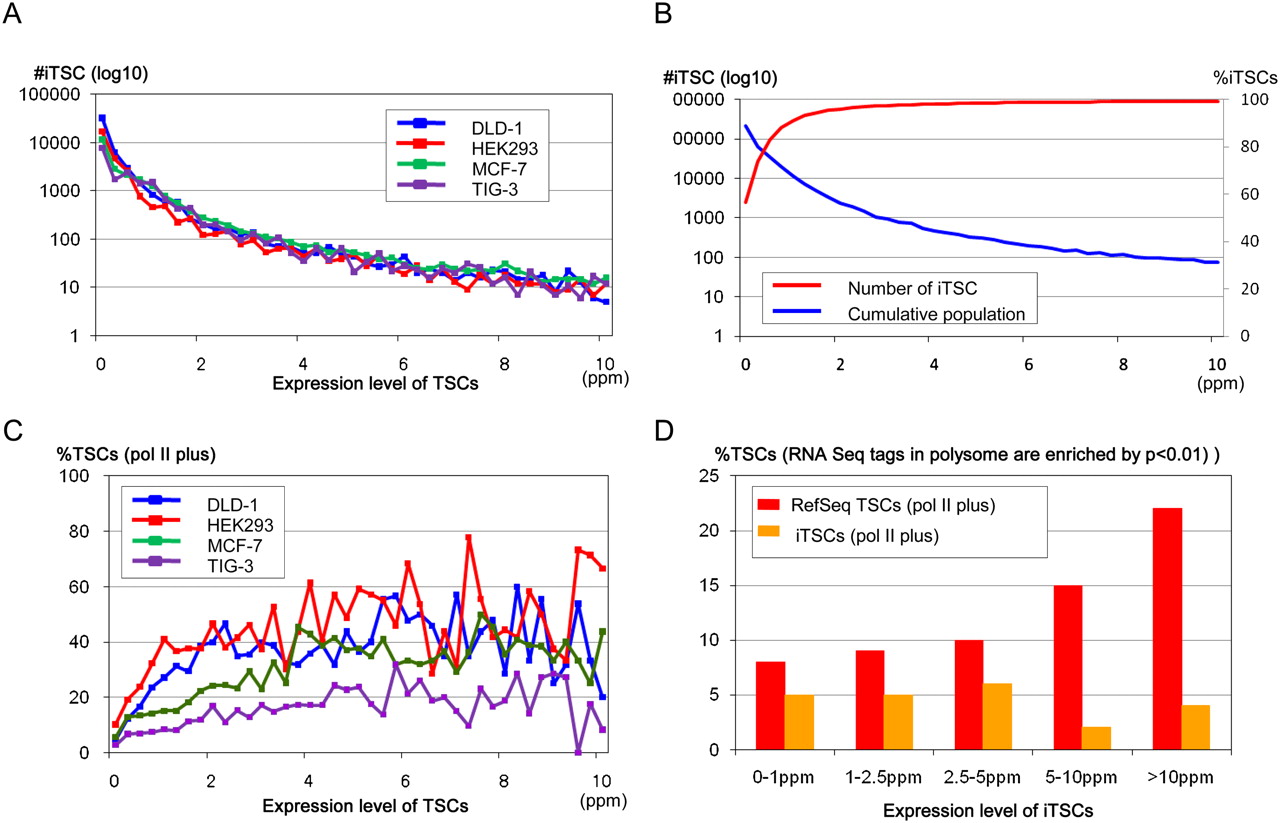
Figure 7.
Characterization of intergenic TSCs. (A) The numbers of iTSCs at the indicated expression level (x-axis) are shown. (B) Numbers and cumulative populations of the iTSCs with maximum expression levels, as indicated on the x-axis, in 12 cell types. (C) Frequencies of the iTSCs that overlapped the pol II binding sites. Origins of the cell lines are as indicated in the inset. (D) The frequencies of the iTSCs for which the RNA-seq tags in the polysomal fractions of DLD-1 cells were enriched (P < 0.01) in comparison to the nuclear and cytoplasmic fractions.


