
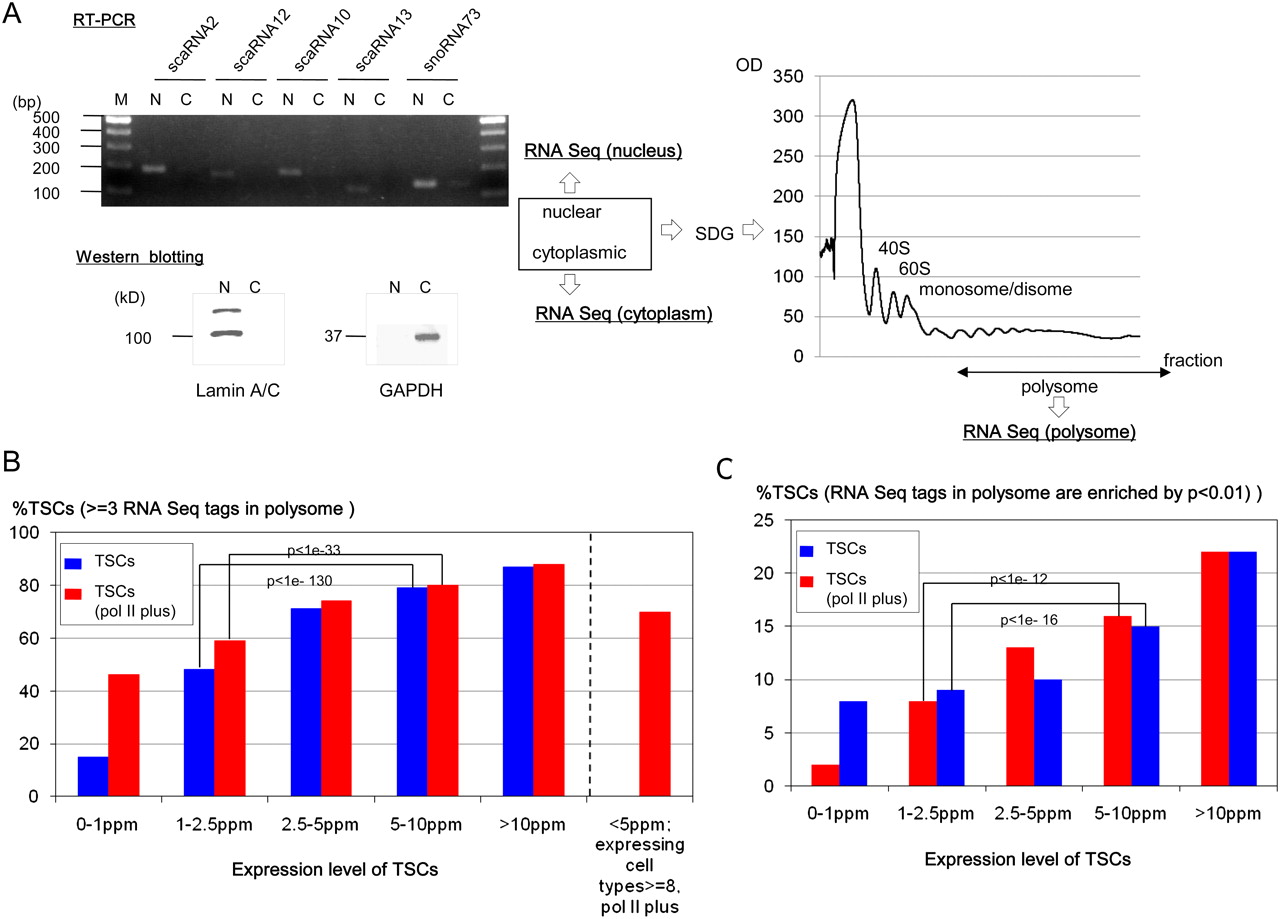
Translational consequences of the TSCs. (A) Subcellular fractionation of the nuclear, cytoplasmic, and polysomal components of DLD-1 cells. (Left) RT–PCR results of the indicated nuclear RNAs. (N) Nuclear fraction, (C) cytoplasmic fraction. (Right) Sucrose density gradient (SDG) purification of polysomes. Separation of the cytoplasmic fraction from the nuclear fraction was confirmed by real time RT–PCR using nuclear scaRNAs and snoRNAs (also see Supplemental Fig. S7A) and by Western blot analysis using nuclear lamin A/C proteins and cytoplasmic glyceraldehyde-3-phosphate dehydrogenase (GAPDH) protein (bottom left). The cytoplasmic fraction was further separated to isolate the polysomal fraction by SDG centrifugation. The fraction from which the RNAs were extracted is indicated by the arrow (right). (B) Number of TSCs supported by three or more RNA-seq tags in the polysomal fraction of DLD-1 cells. The statistical significances of differences in the distribution of the numbers of the supporting RNA-seq tags are also shown for the indicated populations. TSCs that did and did not overlap pol II binding sites in DLD-1 cells are indicated by red and blue boxes, respectively. (C) Number of TSCs that exhibited statistical enrichment (P < 0.01) of the RNA-seq tags in the polysomal fraction in comparison to the nuclear and cytoplasmic fractions. The statistical significances of differences in the distribution of the P-values are also shown for the indicated populations. Details of the RNA tag counts in each population of TSCs are shown in Supplemental Figure S6. The computational procedures used for these analyses are presented in the Methods.


