
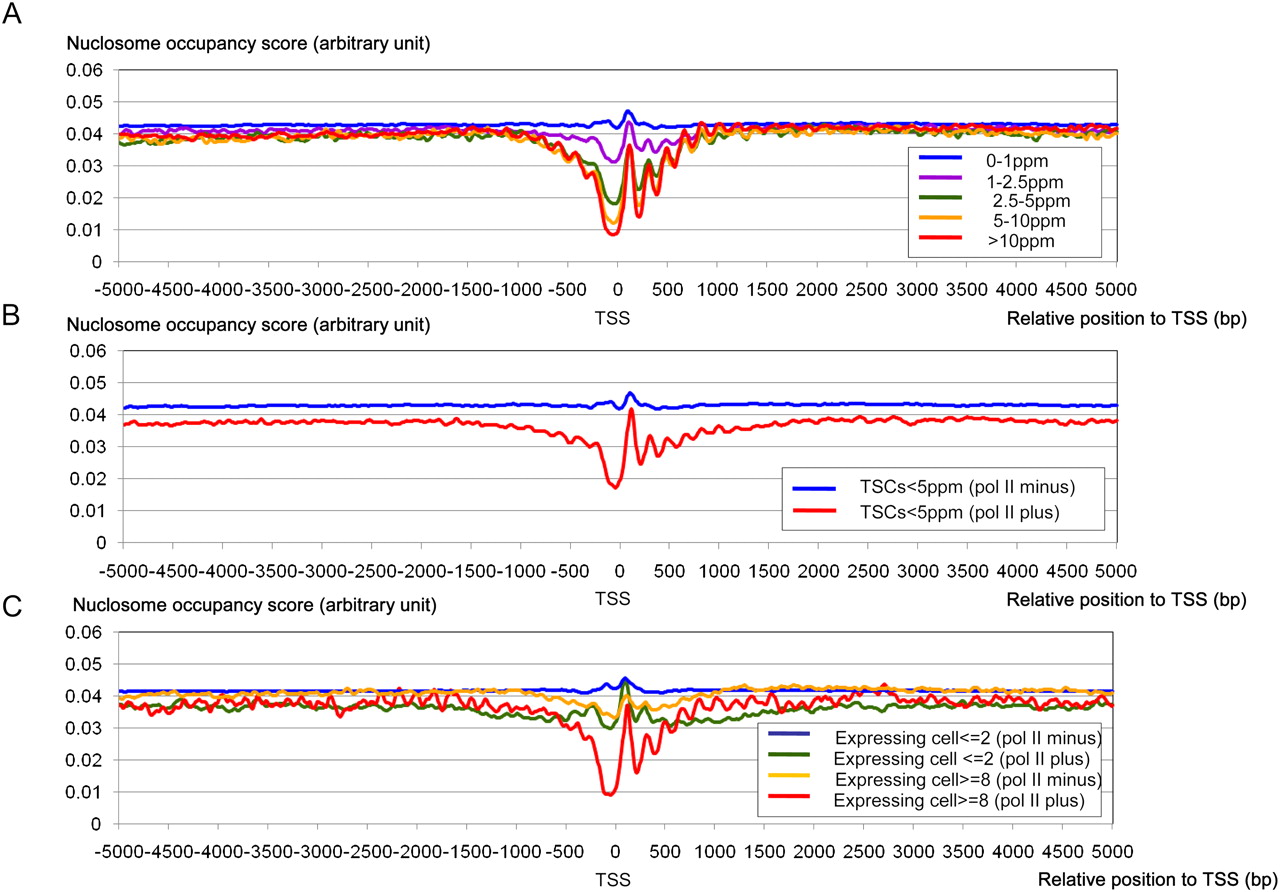
Nucleosome structure around the TSCs with different expression patterns. (A) The nucleosome occupancy scores (y-axis) around the TSCs (x-axis) of different expression levels in DLD-1 cells. Expression levels of the TSCs are as indicated in the inset. The results of a similar analysis of different cell types are shown in Supplemental Figure S3. (B) Nucleosome structures in the regions that surround TSCs with expression levels <5 ppm. The scores for TSCs that did and did not overlap the pol II binding sites in DLD-1 cells are indicated by red and blue lines, respectively. (C) Nucleosome structures in the regions that surround the TSCs that were expressed in two or fewer cell types (blue and green lines) or in at least eight cell types (red and yellow lines). TSCs that did and did not overlap the pol II binding sites in any of the four cell lines (DLD-1, HEK293, MCF-7, or TIG-3) are indicated by blue and green lines, respectively.


