
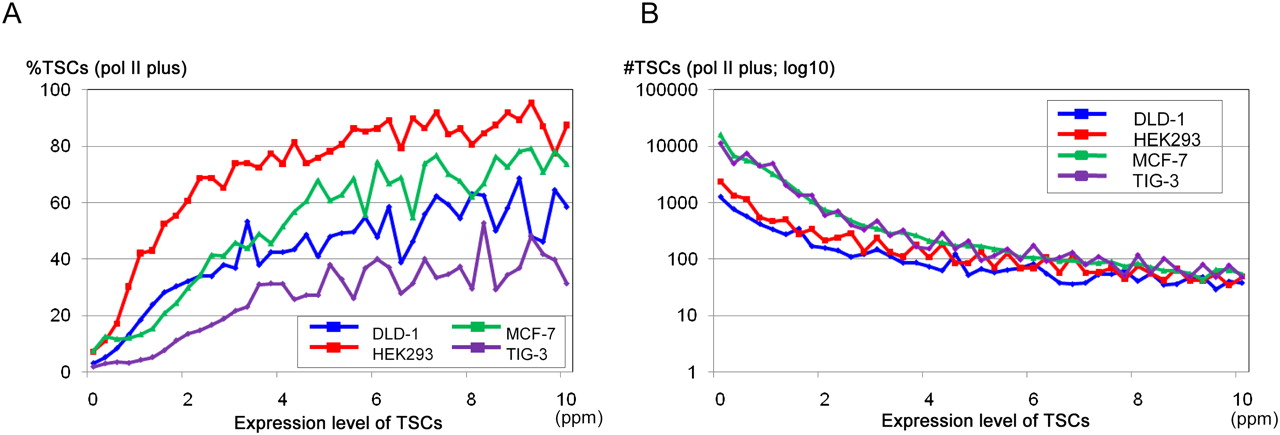
Figure 2.
Expression patterns of the TSCs overlapping the pol II binding sites. (A) Frequencies of the TSCs that overlapped the pol II binding sites in cell lines at the indicated expression levels (x-axis). Cell origins are as indicated in the inset. (B) Frequencies and cumulative populations of the TSCs that overlap pol II binding sites in the respective cell lines are shown.


