
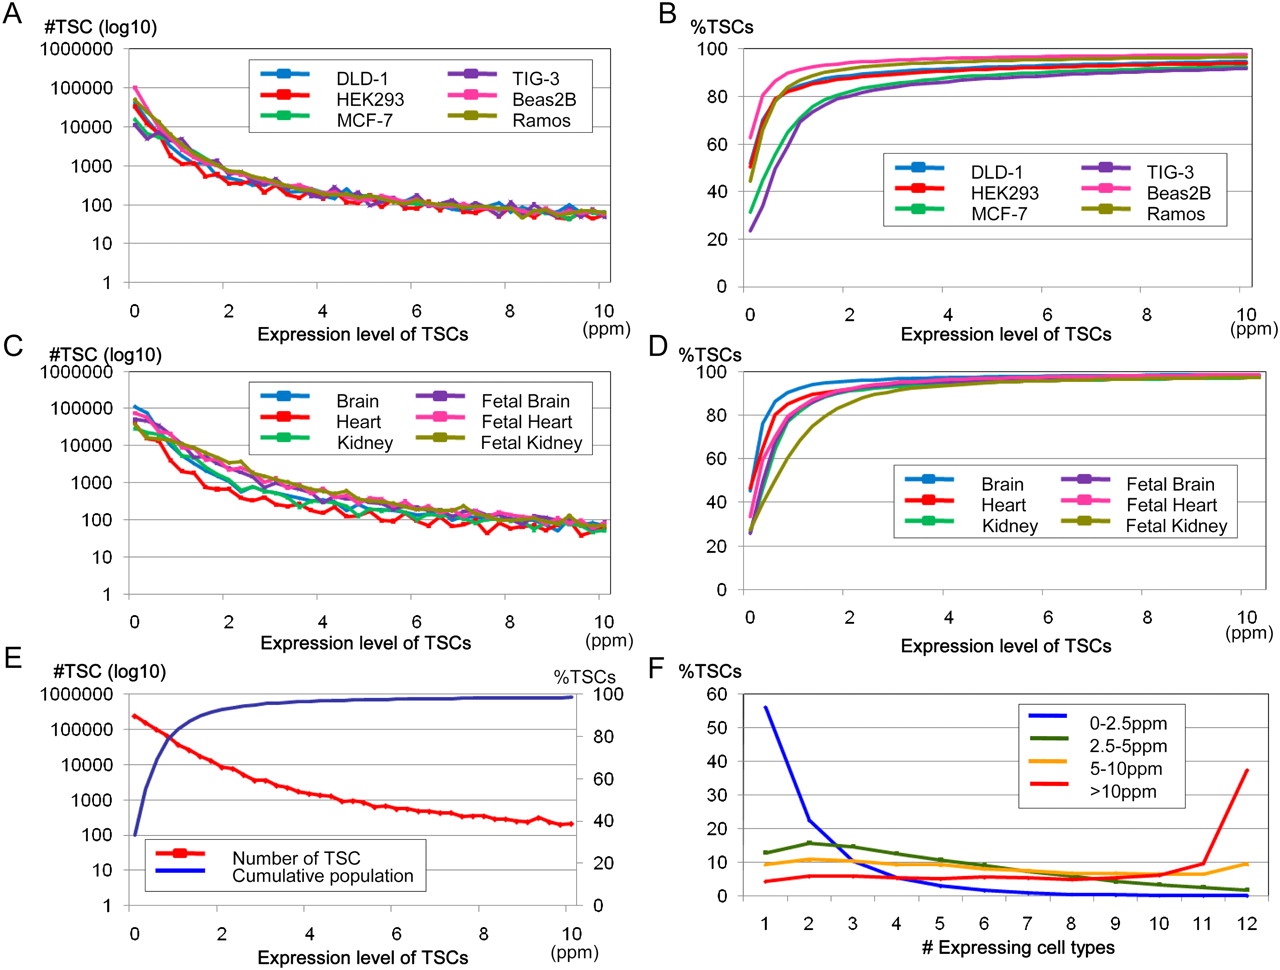
Figure 1.
Expression pattern distributions of the TSCs with the indicated expression levels (x-axis) in the cell lines (A) and tissues (C). The cell and tissue origins of the TSCs are shown in the inset. The cumulative populations of the TSCs with expression levels in excess of the values shown on the x-axis are shown in B (cell lines) and D (tissues). (E) Distribution of the TSCs with maximum expression levels in each of the 12 cell types (red line) and the cumulative population of the TSCs (blue line). (F) Cell type distribution of the TSCs. The number of cell types (x-axis) in which the TSCs with the indicated maximum expression levels (inset) were observed is shown.


