
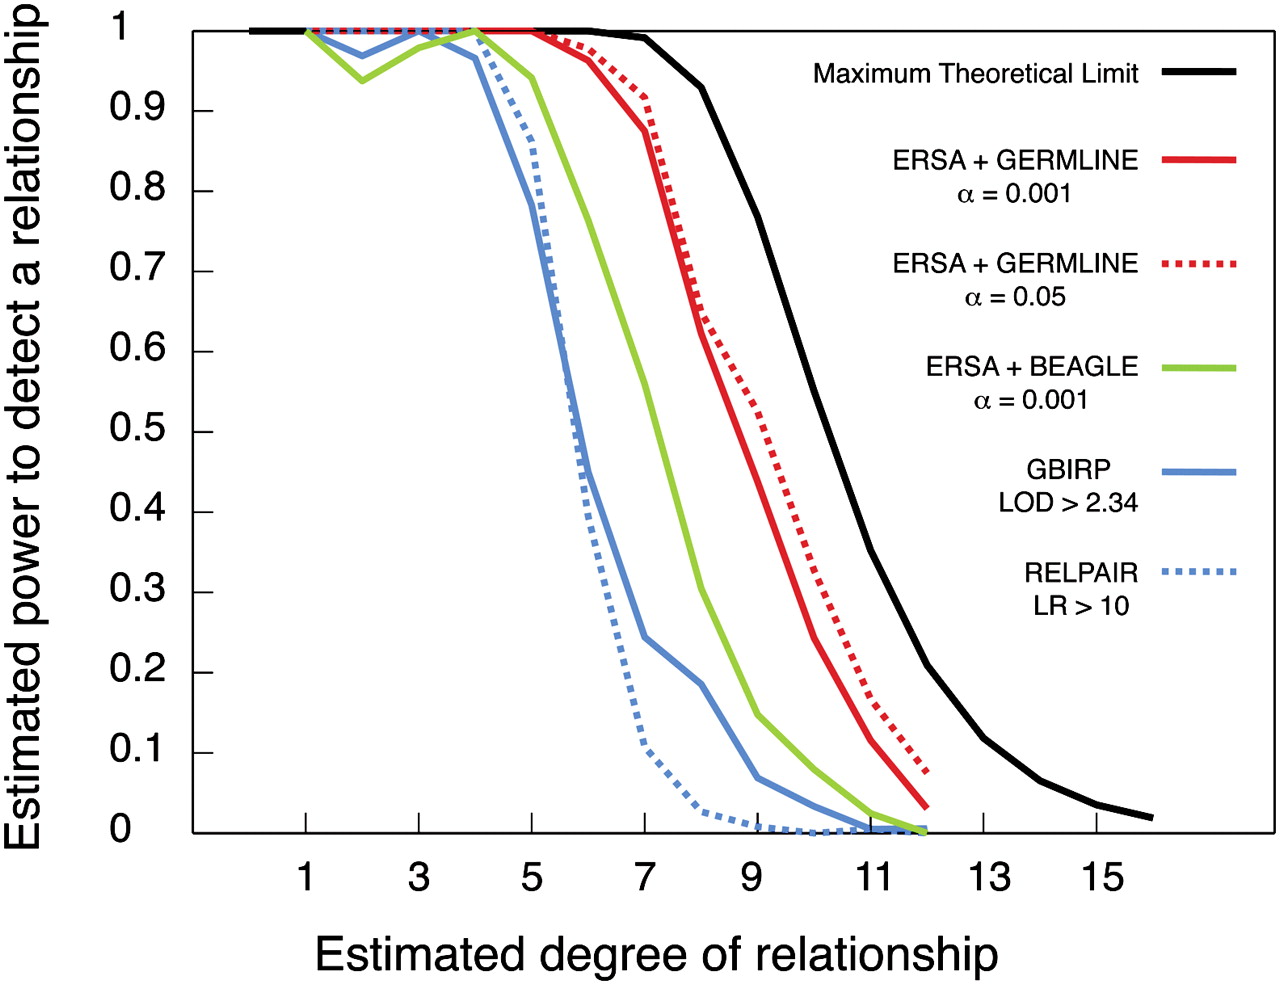
Power to detect recent common ancestry between pairs of individuals known to be related at varying degrees. Each pair of individuals has exactly two known ancestors in the pedigree, and both inheritance paths connecting the pair (one through each ancestor) have the same number of meioses in them. (Black) Maximum theoretical power (the probability that a pair of individuals with the given relationship is genetically related at all, calculated from Eq. 7 with a = 2 and t = 0). The power of ERSA using IBD segments estimated by Germline, with α = 0.05 (red dotted line) and α = 0.001 (red solid line) (two degrees of freedom, d.f.). (Green line) Using IBD segments estimated by fastIBD of the Beagle 3.3 package, ERSA achieves the power shown (α = 0.001, 2 d.f.). (Blue dotted line) The power of RELPAIR (Epstein et al. 2000) to detect a relationship (using 9990 evenly spaced autosomal markers with minor allele frequency MAF > 0.4, default likelihood ratio LR threshold of 10 for reporting a relationship as significant). (Blue solid line) The power of GBIRP (Stankovich et al. 2005) (10,028 evenly spaced autosomal markers with MAF > 0.4, LOD threshold of 2.34 for significance as in Stankovich et al. 2005, corresponding to α = 0.001 with 1 d.f.).


