
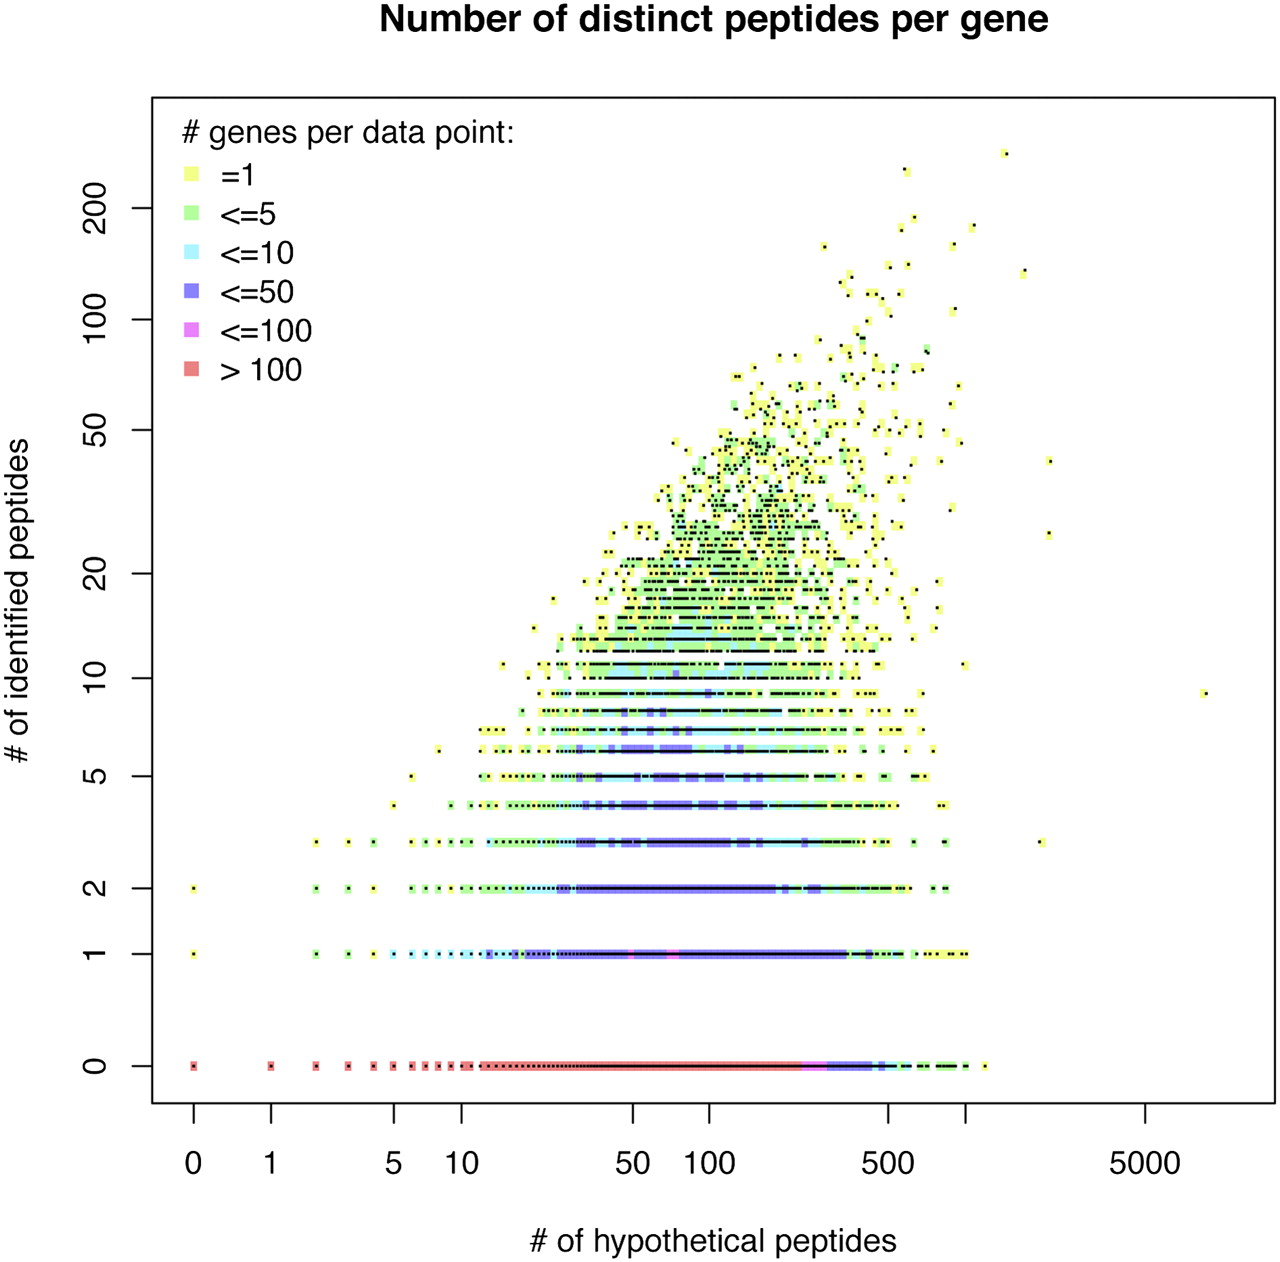
Figure 4.
Correlation analysis between the number of identified peptides and the number of potential identifiable peptides per gene. Since many data points have the same x–y-values, the number of overlaying data points (genes) is encoded with the color gradient available from the legend.


