
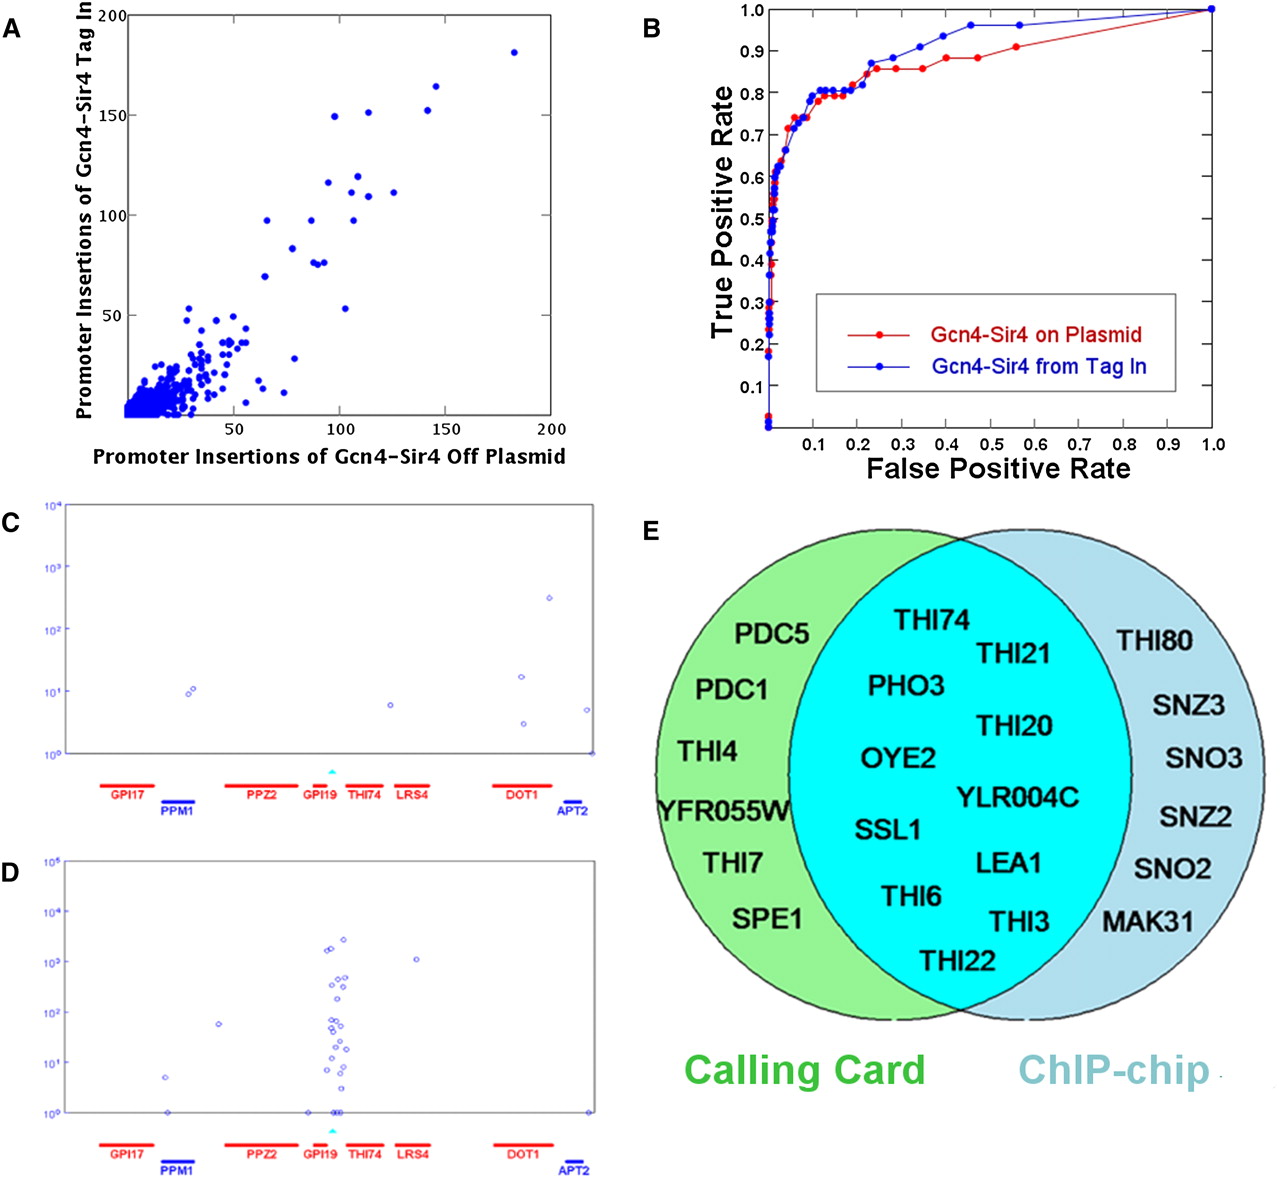
The Calling Card–seq method performs well when the TF–Sir4 is expressed from its native genomic locus. (A) Gcn4–Sir4 fusion expressed from the ADH1 promoter on a plasmid and from its native promoter in the genome produced highly correlated Calling Card insertions. (B) ROC curves are plotted for the Calling Card data when Gcn4 is expressed from the ADH1 promoter on a plasmid (red) and from its native promoter in the genome (blue). (C) Thi2-directed Calling Cards are not enriched in the promoter of THI74 when cells are grown in thiamine-containing media. (D) Thi2-directed Calling Cards are enriched in the promoter of THI74 in cells starved for thiamine. The x-axis specifies gene position; the y-axis is the number of sequencing reads for each insertion (indicated by the blue circle). Each blue circle represents a Calling Card deposited at a unique location. Known Thi2 binding sites are indicated by the cyan triangles. (E) The target genes identified by Calling Card and ChIP methods overlap significantly.


