
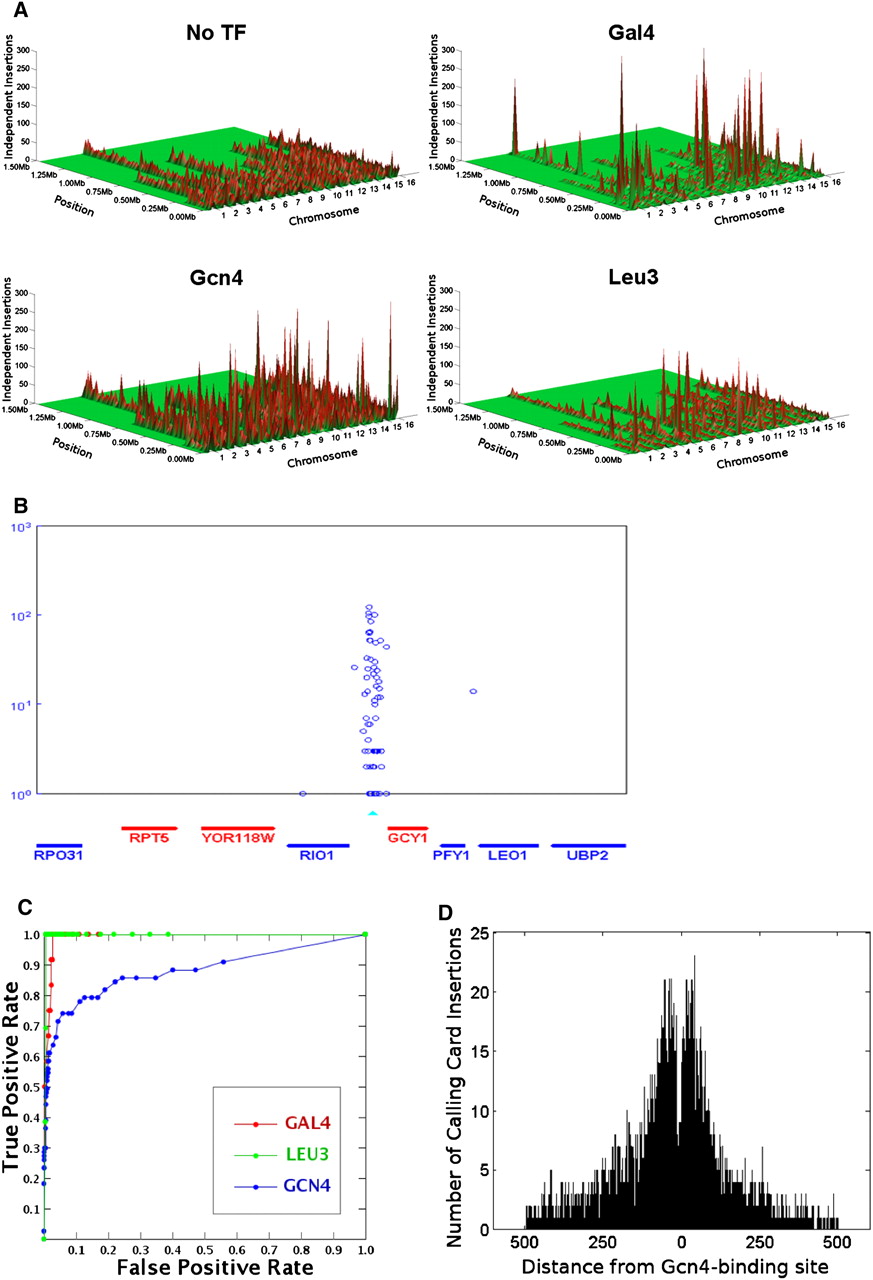
Calling Card–seq accurately predicts target genes and DNA-binding motifs. (A) The genome-wide Ty5 insertion patterns of Gal4, Leu3, Gcn4, and no-TF control. (B) Ty5 integrations are enriched around Gal4 binding sites (indicated by the cyan triangles) in the GCY1 promoter. The x-axis specifies gene position; the y-axis is the number of sequencing reads for each insertion (indicated by the blue circle). Each blue circle represents a Calling Card deposited at a unique location. (C) ROC curves for Gal4 (red), Leu3 (green), and Gcn4 (blue). (D) The distribution of Gcn4-directed Ty5 insertions around known Gcn4p-binding sites. The x-axis specifies the distance from the center of the Gcn4-binding site; the y-axis is the number of insertion events.


