
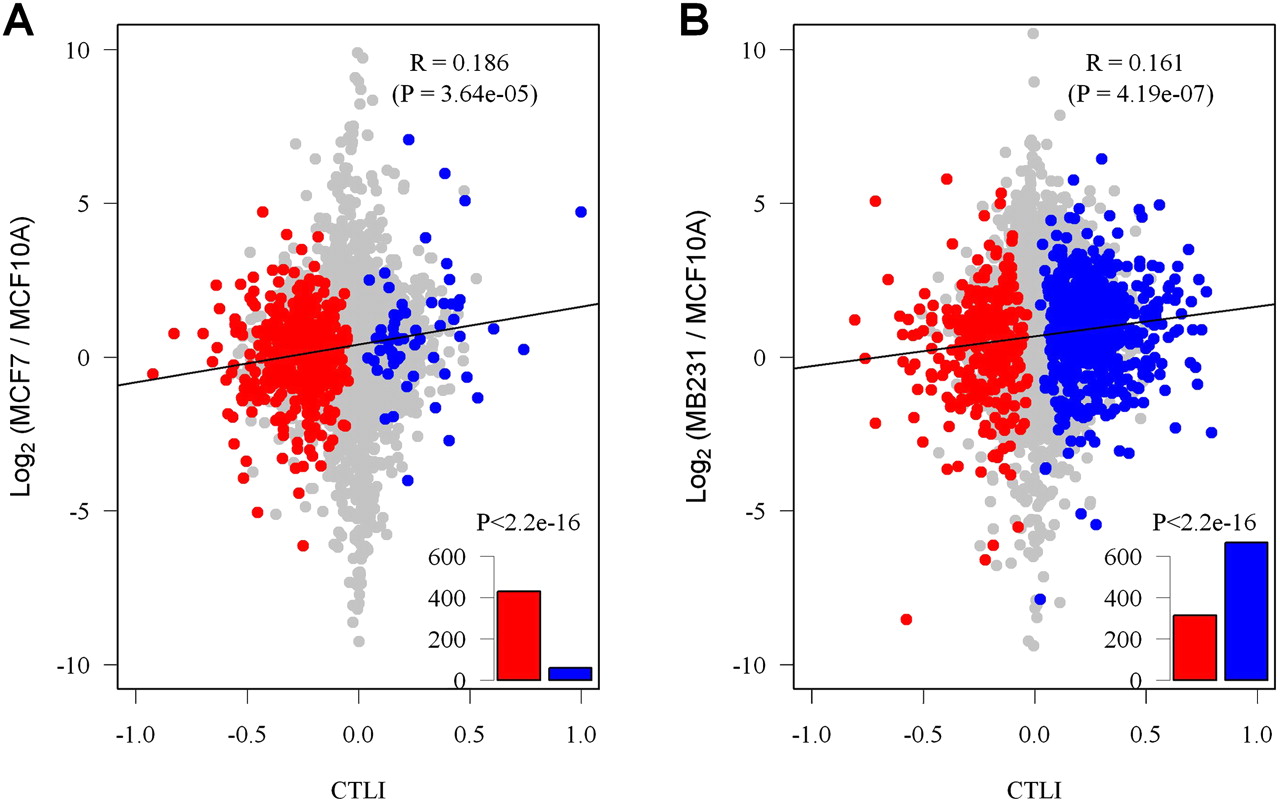
Figure 4.
APA site switching and gene expression levels of normal and cancer cell lines. Cancer tandem 3′ UTR length index (CTLI) is plotted against the logarithm of the expression level ratios between the cancer ([A] MCF7 and [B] MB231) and normal (MCF10A) cell lines. The x-axis denotes CTLI; a larger positive value indicates that longer tandem UTRs are prone to be used in the cancer samples. Genes with significant switching to longer (blue) or shorter (red) tandem UTRs in cancer samples (FDR = 0.01; see Methods) are colored. The y-axis denotes the logarithm of the expression level of genes from the cancer sample relative to the normal sample.


