
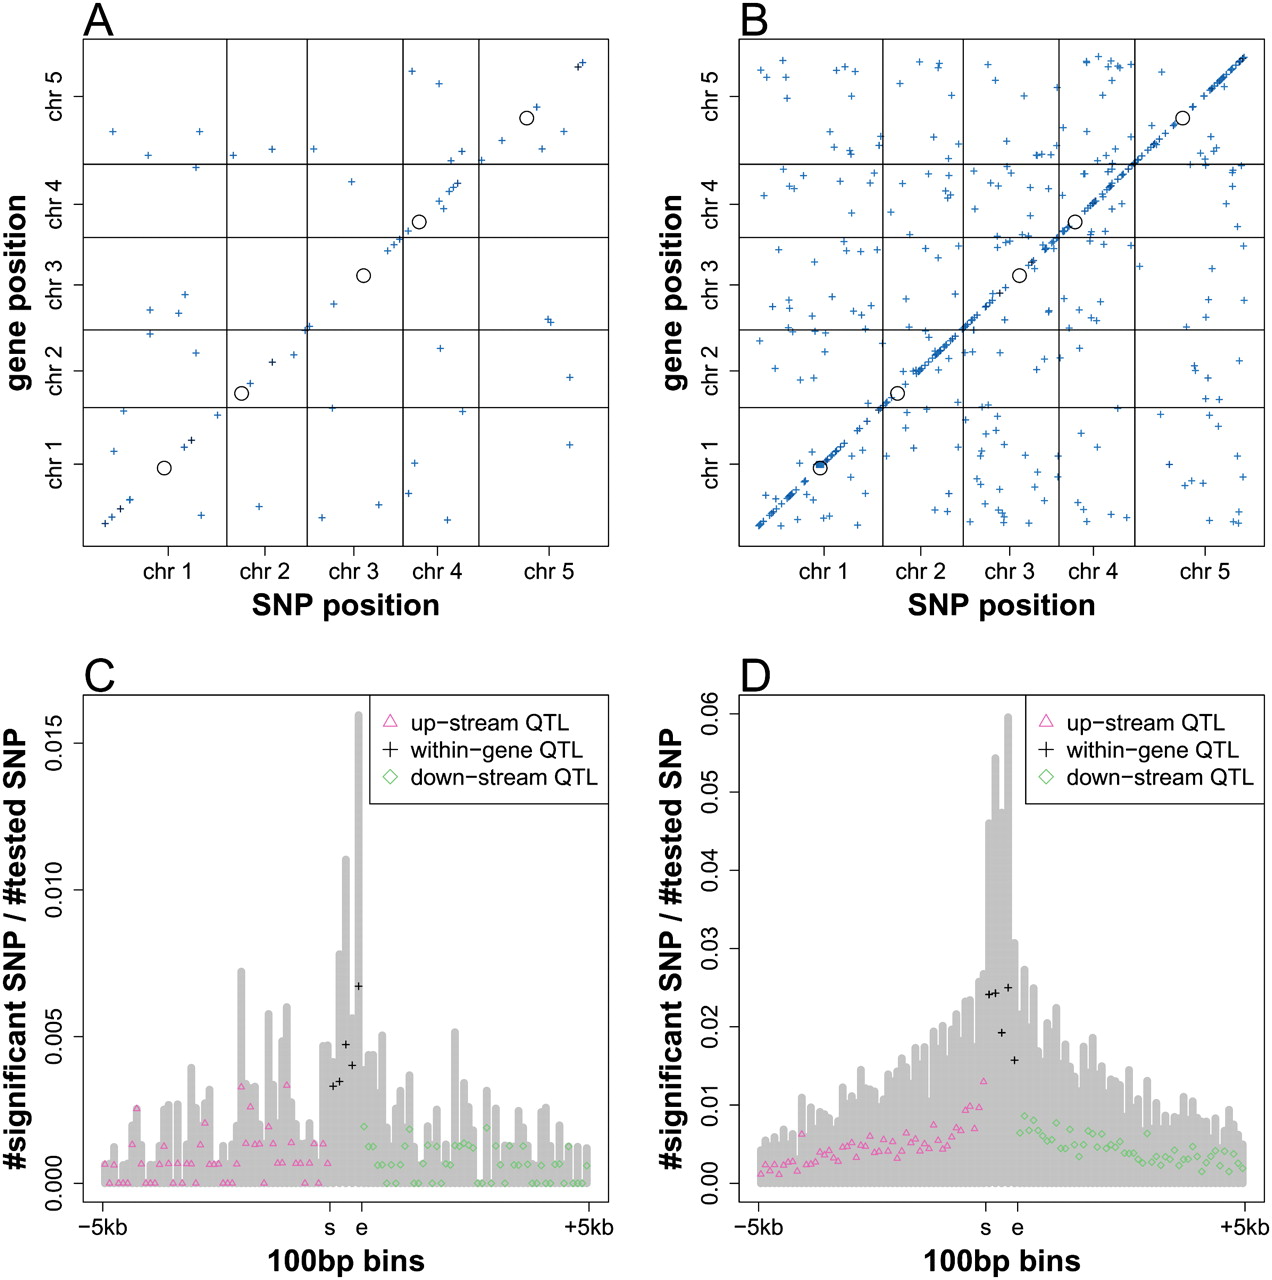
Genetic regulation of splicing variation. The middle position of the mapped introns (A) and exons (B) was plotted against the chromosome position of the associated SNPs, detected in GWA at FDR < 0.2. The intensity of the points indicates the effect (r2) of the corresponding association. (Black circles) Centromeres. The distribution of intron (C) and exon (D) splicing QTL from local scan. Proportion of splicing QTL (the number of splicing QTL after clustering by r2 > 0.8/[the number of SNPs tested]) was plotted along 100-bp bins for 5 kb upstream and 5 kb downstream from the mapped introns or exons. Within introns or exons, the positions were binned to five positional quantiles. (Gray bars) The proportion of associated SNPs before LD clustering. (s) Start position of intron or exon; (e) end position of intron or exon.


